| __timestamp | Cisco Systems, Inc. | ServiceNow, Inc. |
|---|---|---|
| Wednesday, January 1, 2014 | 11437000000 | 437364000 |
| Thursday, January 1, 2015 | 11861000000 | 625043000 |
| Friday, January 1, 2016 | 11433000000 | 859400000 |
| Sunday, January 1, 2017 | 11177000000 | 1157150000 |
| Monday, January 1, 2018 | 11386000000 | 1499083000 |
| Tuesday, January 1, 2019 | 11398000000 | 1873300000 |
| Wednesday, January 1, 2020 | 11094000000 | 2309181000 |
| Friday, January 1, 2021 | 11411000000 | 2889000000 |
| Saturday, January 1, 2022 | 11186000000 | 3549000000 |
| Sunday, January 1, 2023 | 12358000000 | 4164000000 |
| Monday, January 1, 2024 | 13177000000 | 4790000000 |
Unleashing the power of data
In the ever-evolving tech landscape, effective cost management is crucial for sustained growth. Cisco Systems, Inc. and ServiceNow, Inc. offer a compelling study in contrasts over the past decade. From 2014 to 2024, Cisco's Selling, General, and Administrative (SG&A) expenses have shown a steady increase, peaking at approximately $13.2 billion in 2024, marking a 15% rise from 2014. Meanwhile, ServiceNow's SG&A expenses have skyrocketed, growing over tenfold from $437 million in 2014 to nearly $4.8 billion in 2024. This dramatic increase underscores ServiceNow's aggressive expansion strategy in the competitive cloud computing market. While Cisco's expenses reflect a mature company's stable growth, ServiceNow's figures highlight its rapid scaling efforts. These insights reveal how each company navigates its unique challenges and opportunities in the tech industry.
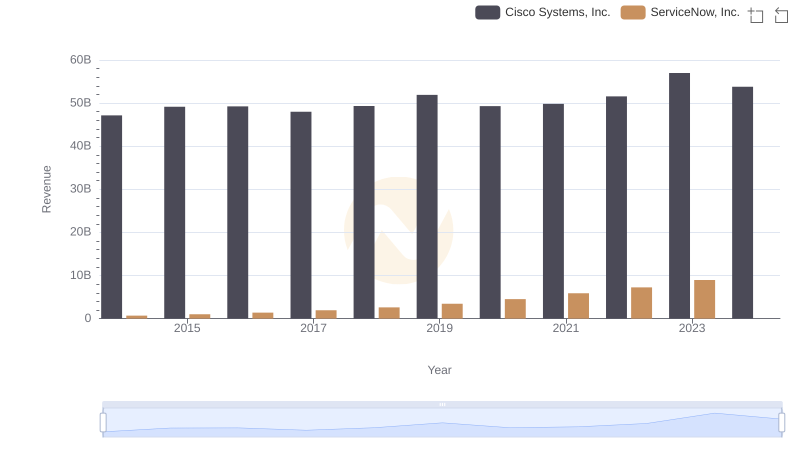
Cisco Systems, Inc. or ServiceNow, Inc.: Who Leads in Yearly Revenue?
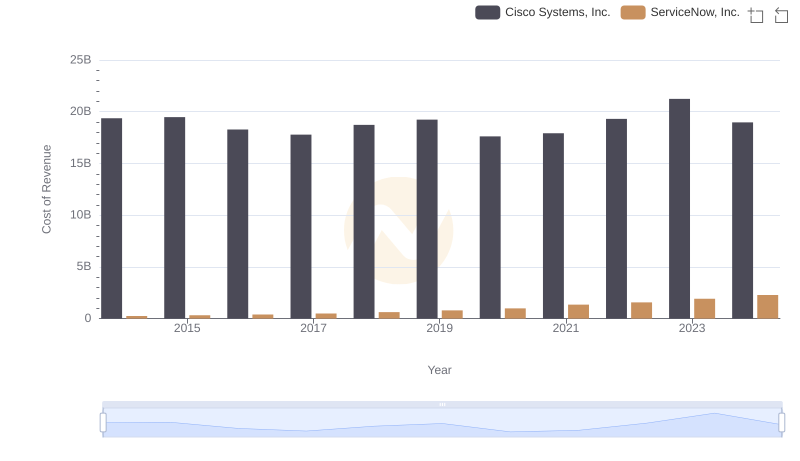
Analyzing Cost of Revenue: Cisco Systems, Inc. and ServiceNow, Inc.
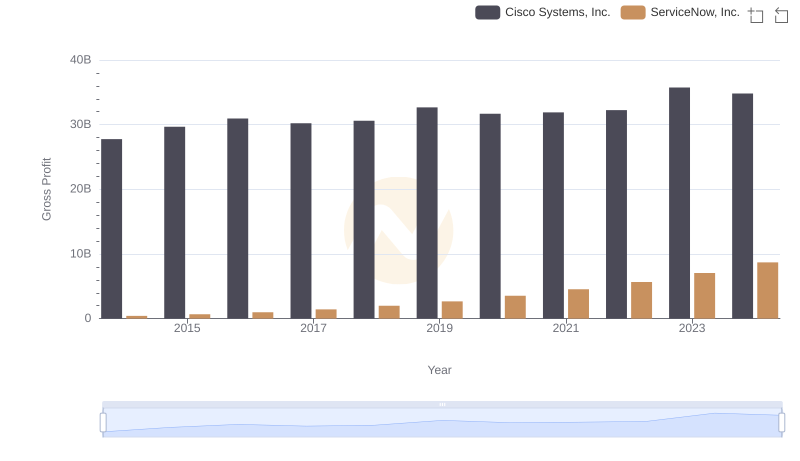
Gross Profit Trends Compared: Cisco Systems, Inc. vs ServiceNow, Inc.
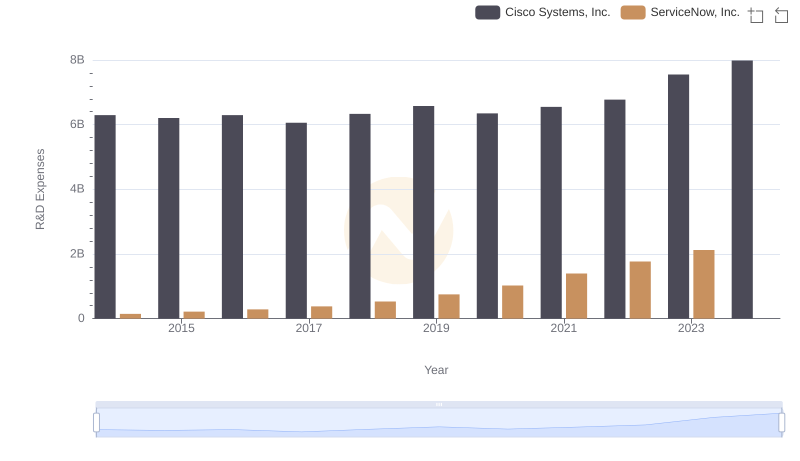
Who Prioritizes Innovation? R&D Spending Compared for Cisco Systems, Inc. and ServiceNow, Inc.
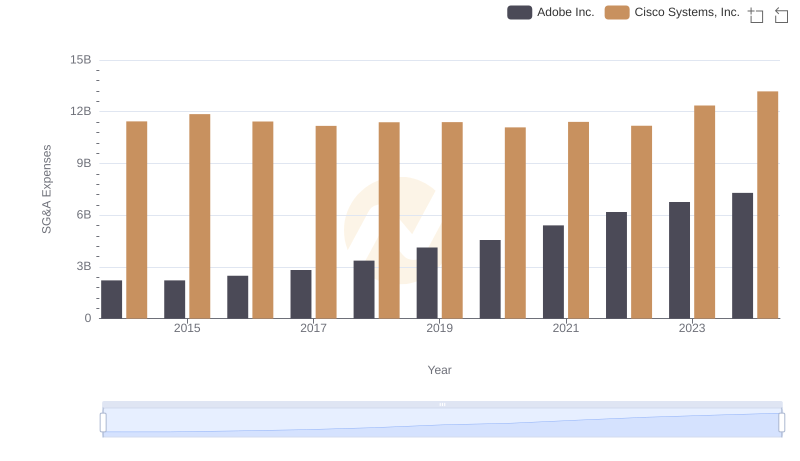
Cisco Systems, Inc. vs Adobe Inc.: SG&A Expense Trends
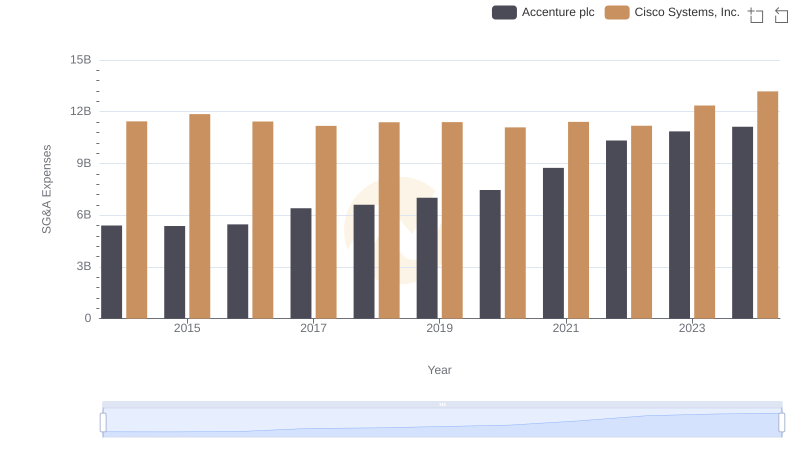
Cisco Systems, Inc. vs Accenture plc: SG&A Expense Trends
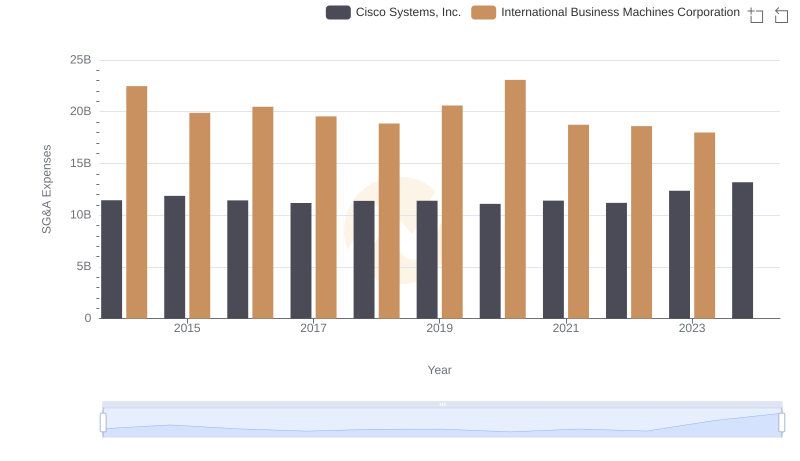
Breaking Down SG&A Expenses: Cisco Systems, Inc. vs International Business Machines Corporation
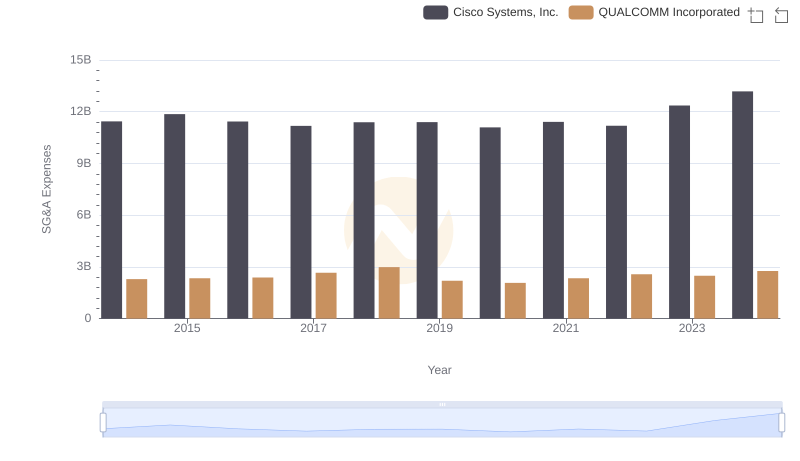
SG&A Efficiency Analysis: Comparing Cisco Systems, Inc. and QUALCOMM Incorporated
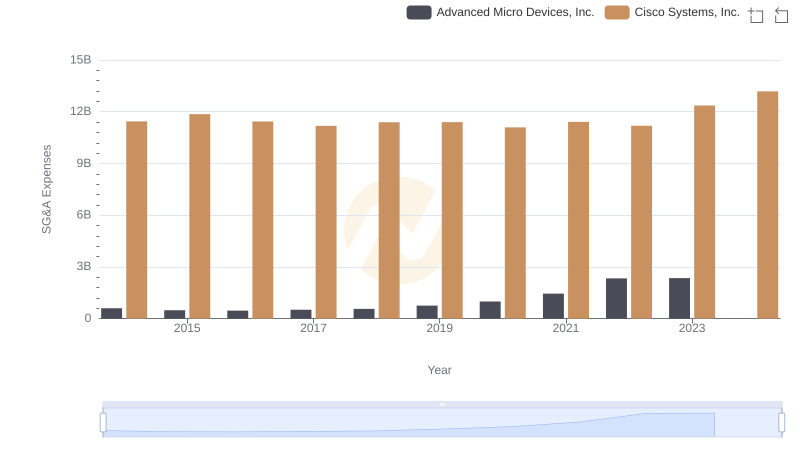
SG&A Efficiency Analysis: Comparing Cisco Systems, Inc. and Advanced Micro Devices, Inc.
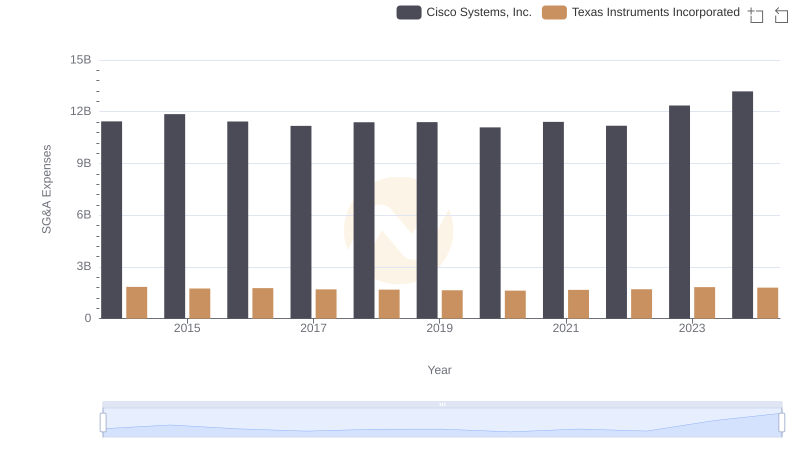
Cisco Systems, Inc. or Texas Instruments Incorporated: Who Manages SG&A Costs Better?
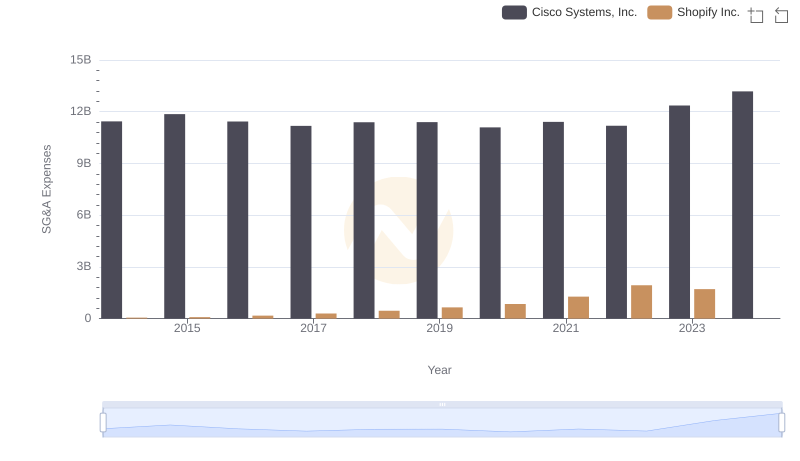
Cisco Systems, Inc. and Shopify Inc.: SG&A Spending Patterns Compared
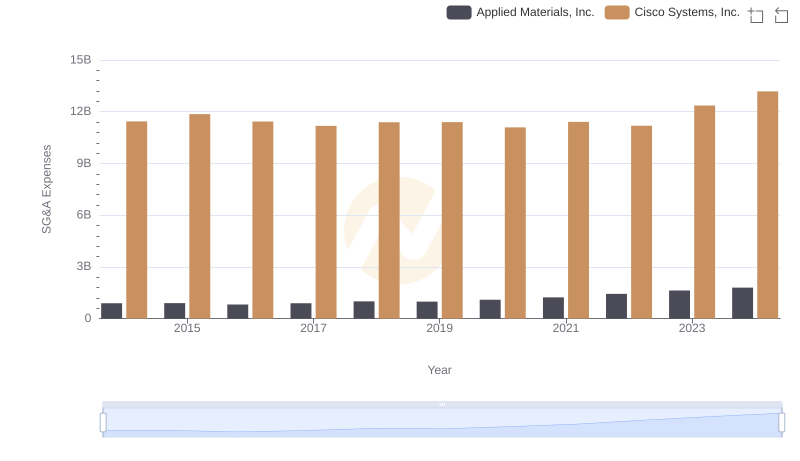
Operational Costs Compared: SG&A Analysis of Cisco Systems, Inc. and Applied Materials, Inc.