| __timestamp | Cisco Systems, Inc. | ServiceNow, Inc. |
|---|---|---|
| Wednesday, January 1, 2014 | 27769000000 | 433787000 |
| Thursday, January 1, 2015 | 29681000000 | 676067000 |
| Friday, January 1, 2016 | 30960000000 | 991831000 |
| Sunday, January 1, 2017 | 30224000000 | 1433254000 |
| Monday, January 1, 2018 | 30606000000 | 1986158000 |
| Tuesday, January 1, 2019 | 32666000000 | 2663792000 |
| Wednesday, January 1, 2020 | 31683000000 | 3532371000 |
| Friday, January 1, 2021 | 31894000000 | 4543000000 |
| Saturday, January 1, 2022 | 32248000000 | 5672000000 |
| Sunday, January 1, 2023 | 35753000000 | 7050000000 |
| Monday, January 1, 2024 | 34828000000 | 8697000000 |
Data in motion
In the ever-evolving tech industry, understanding financial trends is crucial. This analysis compares the gross profit trajectories of two tech giants: Cisco Systems, Inc. and ServiceNow, Inc., from 2014 to 2024. Cisco, a stalwart in networking, consistently outperformed ServiceNow, a cloud computing innovator, in terms of gross profit. However, the growth rate tells a different story. While Cisco's gross profit increased by approximately 25% over the decade, ServiceNow's surged by an impressive 1,900%, reflecting its rapid expansion and market penetration.
This comparison not only highlights the dynamic nature of the tech industry but also underscores the importance of strategic positioning in achieving financial success.
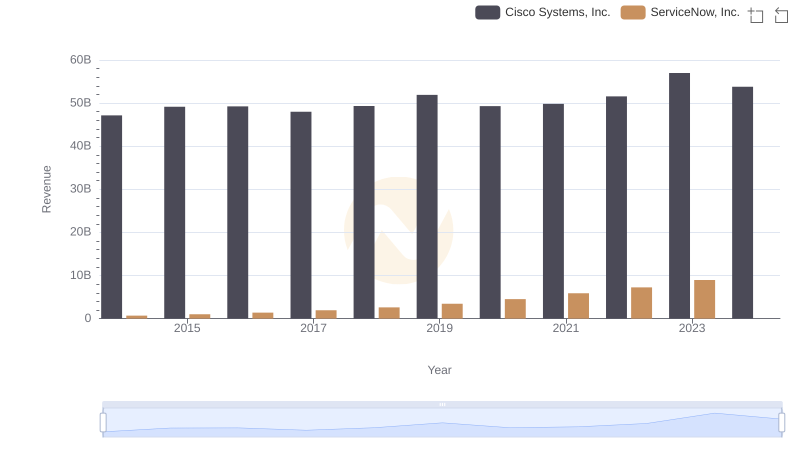
Cisco Systems, Inc. or ServiceNow, Inc.: Who Leads in Yearly Revenue?
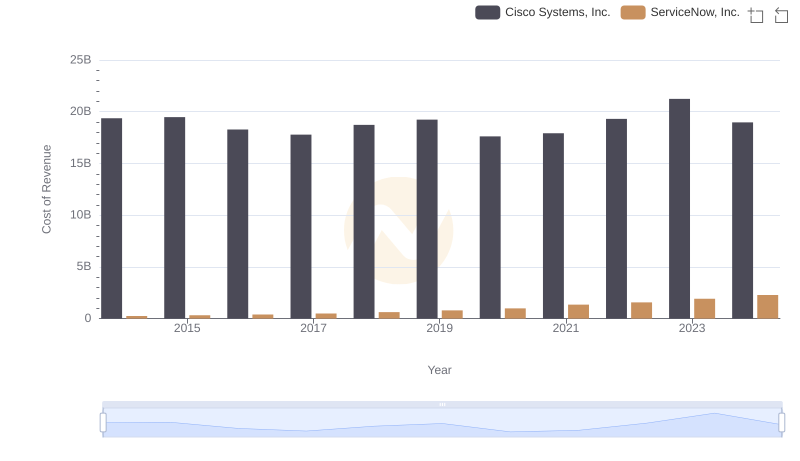
Analyzing Cost of Revenue: Cisco Systems, Inc. and ServiceNow, Inc.
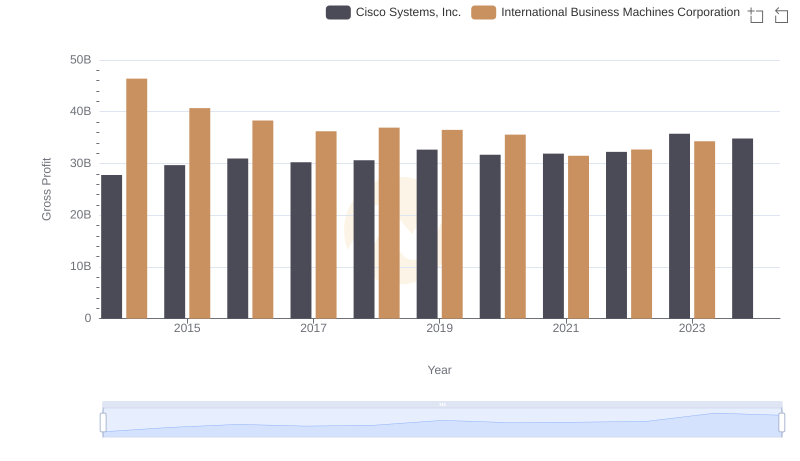
Key Insights on Gross Profit: Cisco Systems, Inc. vs International Business Machines Corporation
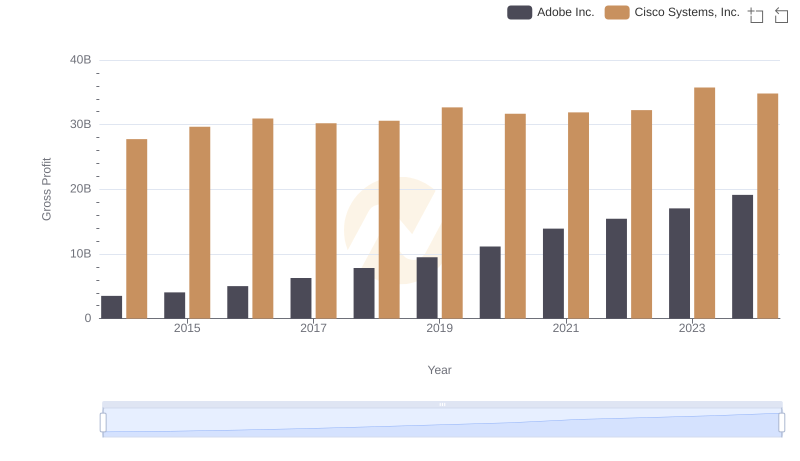
Key Insights on Gross Profit: Cisco Systems, Inc. vs Adobe Inc.
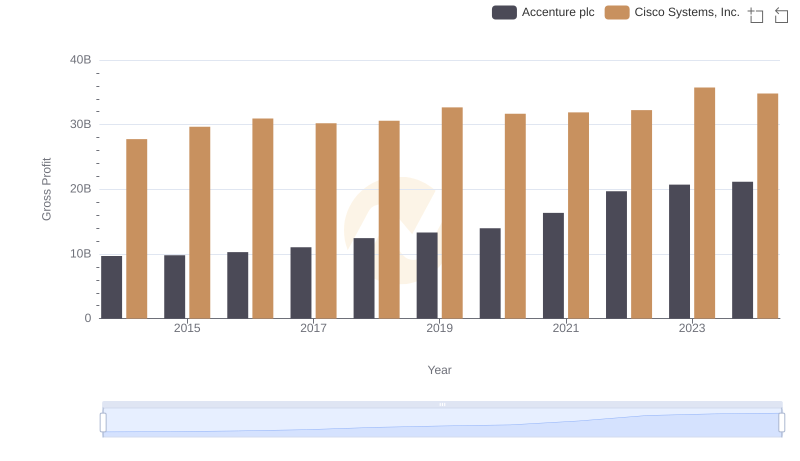
Cisco Systems, Inc. and Accenture plc: A Detailed Gross Profit Analysis
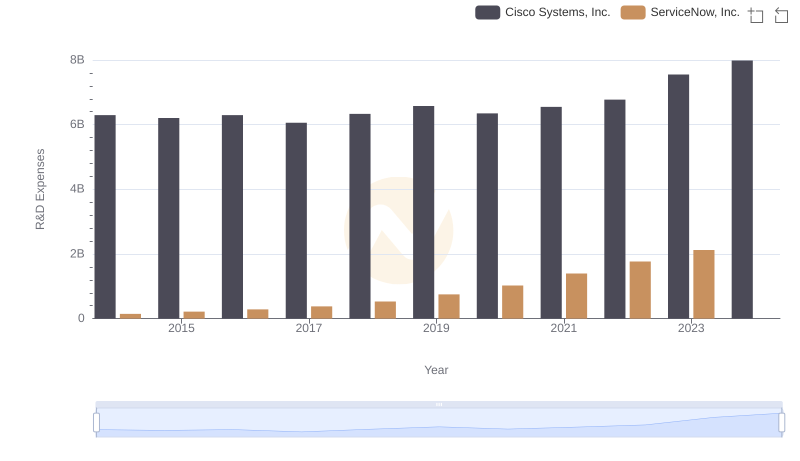
Who Prioritizes Innovation? R&D Spending Compared for Cisco Systems, Inc. and ServiceNow, Inc.
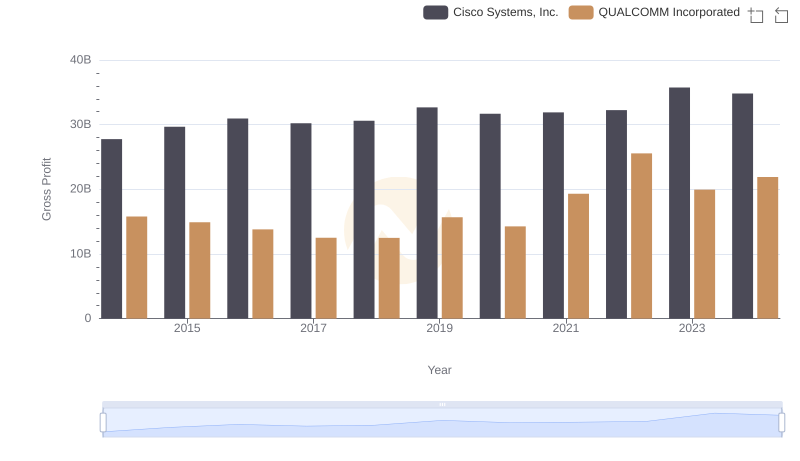
Who Generates Higher Gross Profit? Cisco Systems, Inc. or QUALCOMM Incorporated
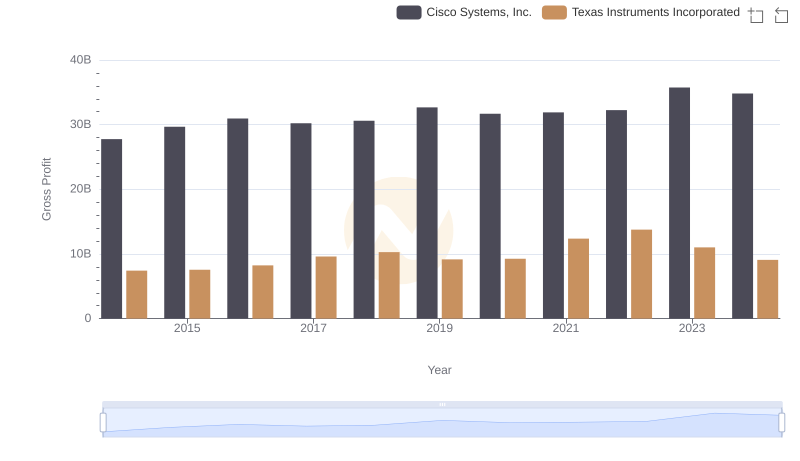
Cisco Systems, Inc. and Texas Instruments Incorporated: A Detailed Gross Profit Analysis
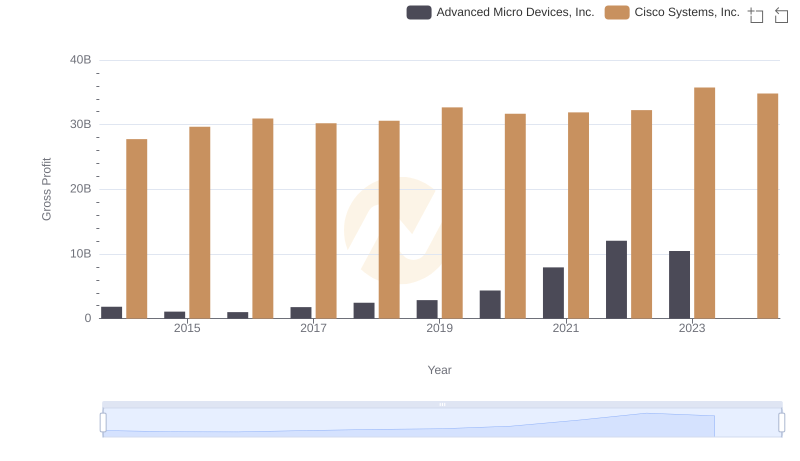
Cisco Systems, Inc. and Advanced Micro Devices, Inc.: A Detailed Gross Profit Analysis
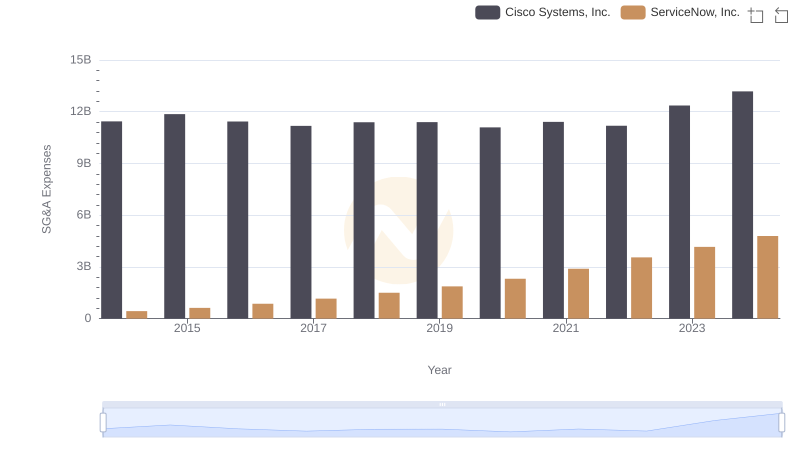
Cost Management Insights: SG&A Expenses for Cisco Systems, Inc. and ServiceNow, Inc.
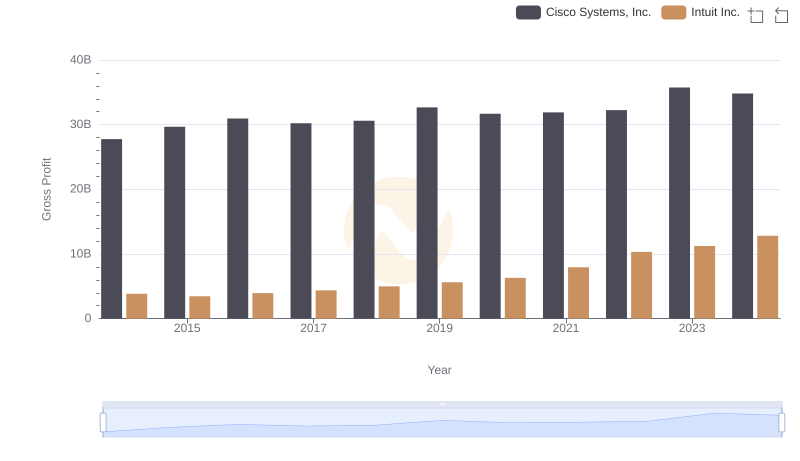
Who Generates Higher Gross Profit? Cisco Systems, Inc. or Intuit Inc.
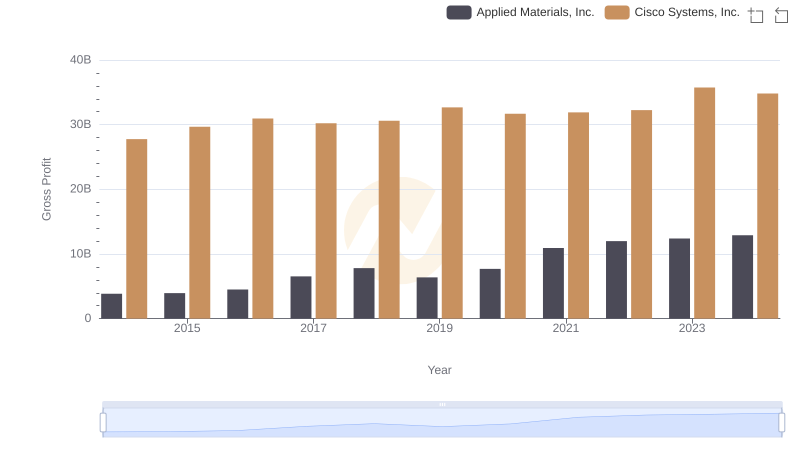
Gross Profit Analysis: Comparing Cisco Systems, Inc. and Applied Materials, Inc.