| __timestamp | Cisco Systems, Inc. | Micron Technology, Inc. |
|---|---|---|
| Wednesday, January 1, 2014 | 11437000000 | 707000000 |
| Thursday, January 1, 2015 | 11861000000 | 719000000 |
| Friday, January 1, 2016 | 11433000000 | 659000000 |
| Sunday, January 1, 2017 | 11177000000 | 743000000 |
| Monday, January 1, 2018 | 11386000000 | 813000000 |
| Tuesday, January 1, 2019 | 11398000000 | 836000000 |
| Wednesday, January 1, 2020 | 11094000000 | 881000000 |
| Friday, January 1, 2021 | 11411000000 | 894000000 |
| Saturday, January 1, 2022 | 11186000000 | 1066000000 |
| Sunday, January 1, 2023 | 12358000000 | 920000000 |
| Monday, January 1, 2024 | 13177000000 | 1129000000 |
Infusing magic into the data realm
In the ever-evolving tech landscape, understanding the financial strategies of industry leaders is crucial. Cisco Systems, Inc. and Micron Technology, Inc. offer a fascinating study in contrasts when it comes to Selling, General, and Administrative (SG&A) expenses. Over the past decade, Cisco's SG&A spending has consistently dwarfed that of Micron, averaging nearly 14 times higher. This disparity highlights Cisco's expansive operational scale and strategic investments in sales and administration.
From 2014 to 2024, Cisco's SG&A expenses have shown a steady upward trend, peaking in 2024 with a 15% increase from 2014. In contrast, Micron's SG&A expenses have been more volatile, with a notable 60% rise from 2014 to 2024. These patterns reflect differing business models and market strategies, with Cisco focusing on broad market penetration and Micron on targeted innovation. Understanding these trends provides valuable insights into the financial health and strategic priorities of these tech titans.
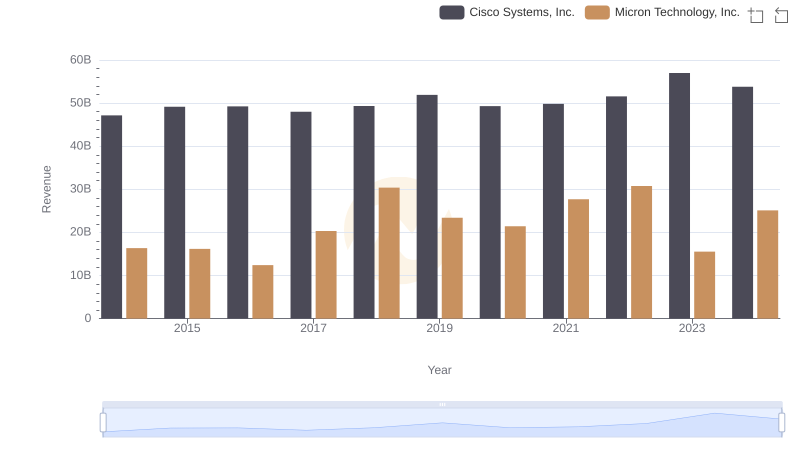
Cisco Systems, Inc. or Micron Technology, Inc.: Who Leads in Yearly Revenue?
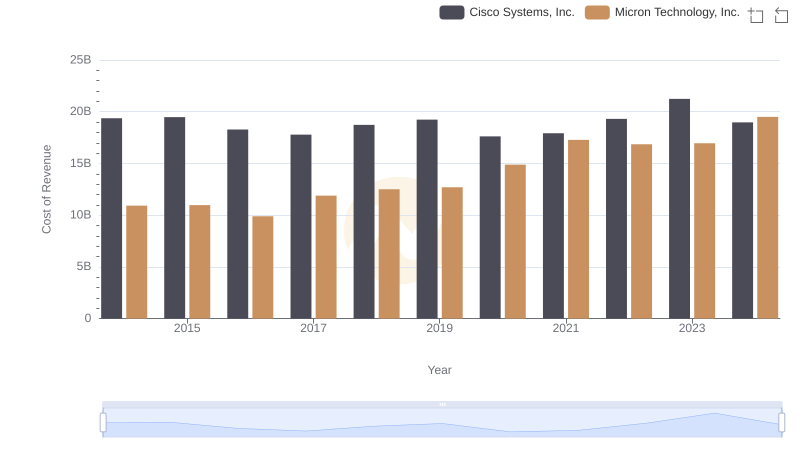
Analyzing Cost of Revenue: Cisco Systems, Inc. and Micron Technology, Inc.
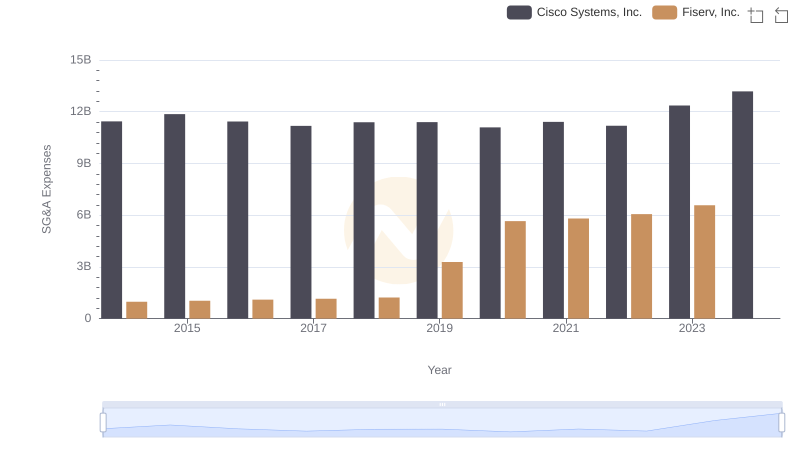
SG&A Efficiency Analysis: Comparing Cisco Systems, Inc. and Fiserv, Inc.
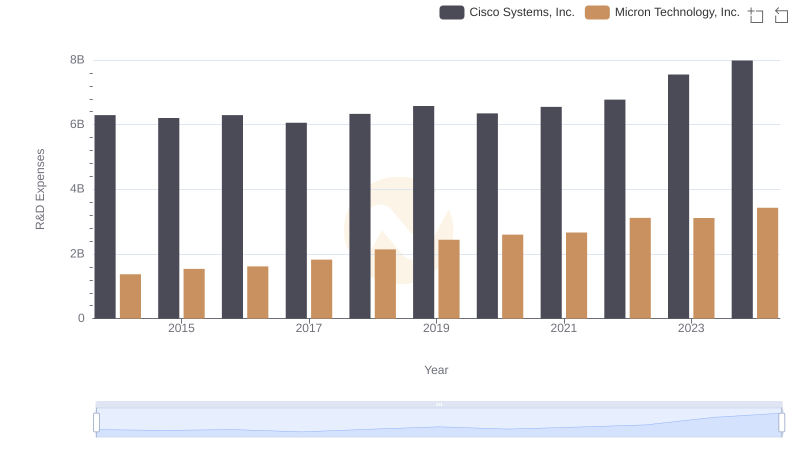
Who Prioritizes Innovation? R&D Spending Compared for Cisco Systems, Inc. and Micron Technology, Inc.

Comparing SG&A Expenses: Cisco Systems, Inc. vs Fiserv, Inc. Trends and Insights
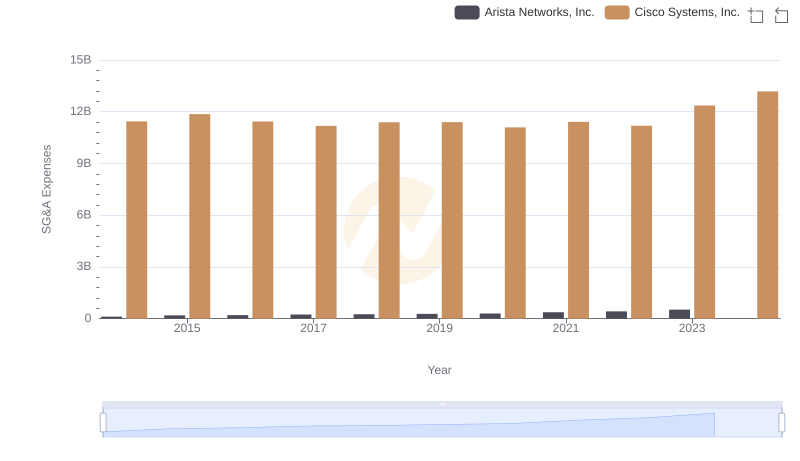
Operational Costs Compared: SG&A Analysis of Cisco Systems, Inc. and Arista Networks, Inc.
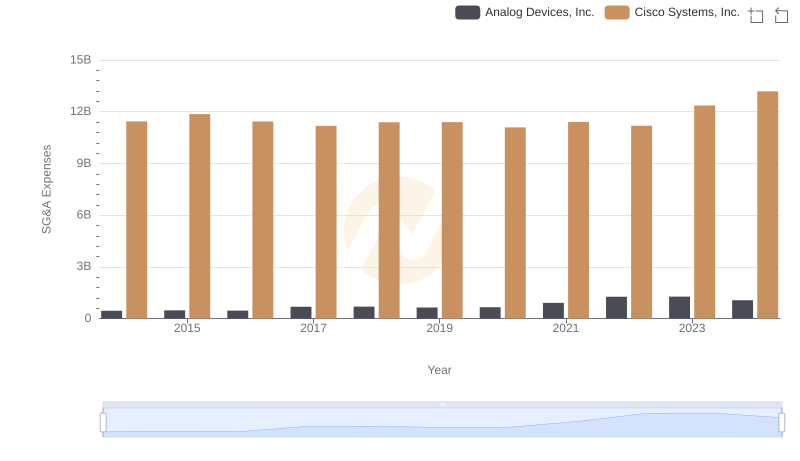
Cisco Systems, Inc. vs Analog Devices, Inc.: SG&A Expense Trends
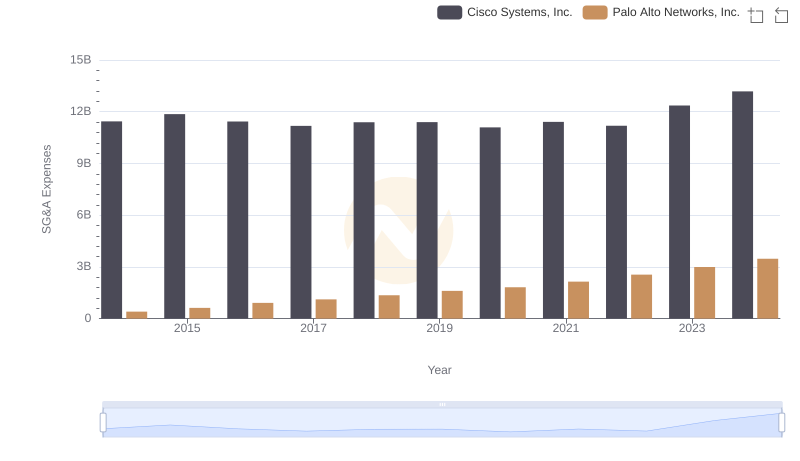
Cisco Systems, Inc. and Palo Alto Networks, Inc.: SG&A Spending Patterns Compared
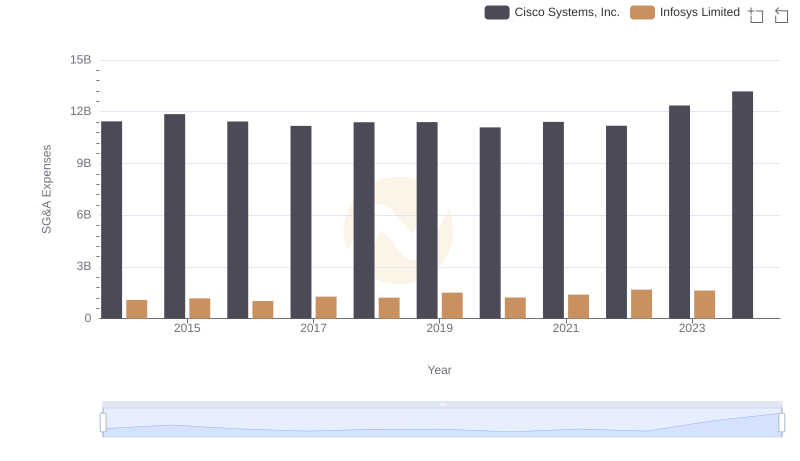
Cisco Systems, Inc. and Infosys Limited: SG&A Spending Patterns Compared
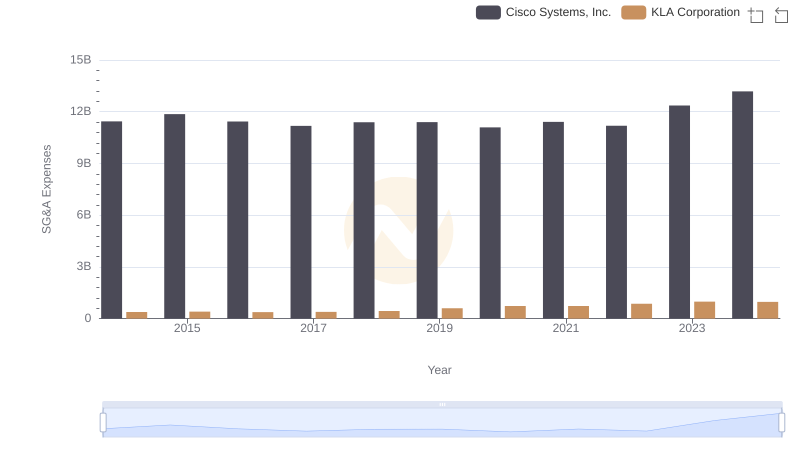
Who Optimizes SG&A Costs Better? Cisco Systems, Inc. or KLA Corporation
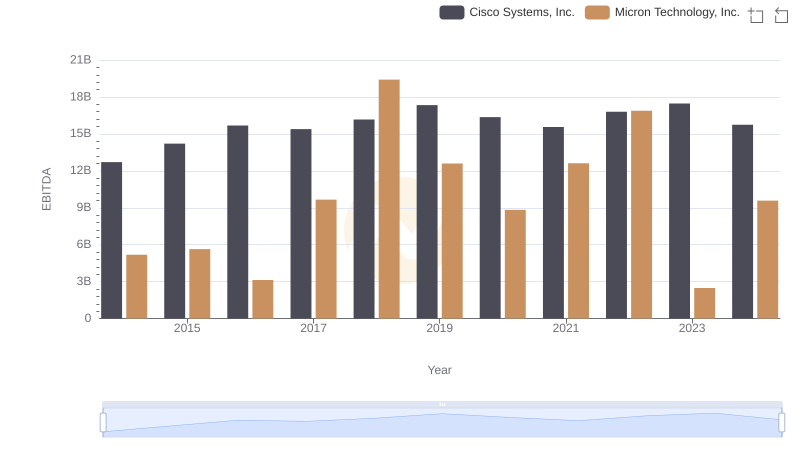
A Side-by-Side Analysis of EBITDA: Cisco Systems, Inc. and Micron Technology, Inc.
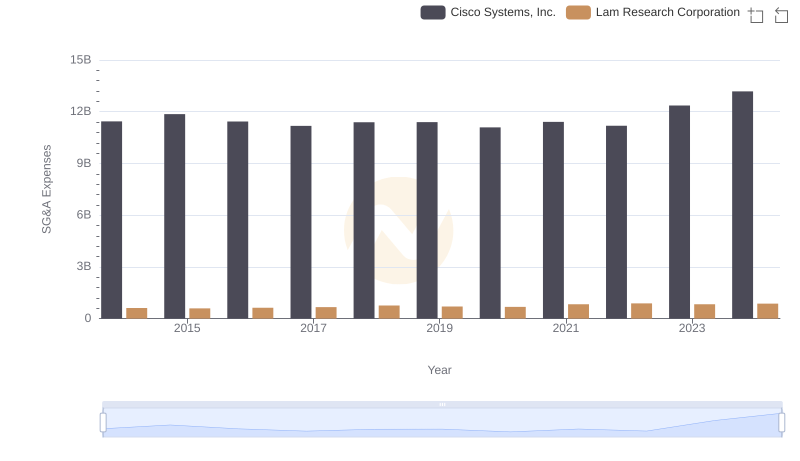
Who Optimizes SG&A Costs Better? Cisco Systems, Inc. or Lam Research Corporation