| __timestamp | Cisco Systems, Inc. | Lam Research Corporation |
|---|---|---|
| Wednesday, January 1, 2014 | 12709000000 | 977923000 |
| Thursday, January 1, 2015 | 14209000000 | 1155224000 |
| Friday, January 1, 2016 | 15678000000 | 1365284000 |
| Sunday, January 1, 2017 | 15383000000 | 2218837000 |
| Monday, January 1, 2018 | 16172000000 | 3539694000 |
| Tuesday, January 1, 2019 | 17334000000 | 2774013000 |
| Wednesday, January 1, 2020 | 16363000000 | 2942327000 |
| Friday, January 1, 2021 | 15558000000 | 4789174000 |
| Saturday, January 1, 2022 | 16794000000 | 5715561000 |
| Sunday, January 1, 2023 | 17471000000 | 5637608000 |
| Monday, January 1, 2024 | 15747000000 | 4905157000 |
Unveiling the hidden dimensions of data
In the ever-evolving tech landscape, Cisco Systems, Inc. and Lam Research Corporation stand as titans, each carving its niche. Over the past decade, Cisco's EBITDA has consistently outpaced Lam's, with Cisco averaging nearly five times Lam's EBITDA. However, Lam's growth trajectory is noteworthy, with a staggering 480% increase from 2014 to 2023, compared to Cisco's 37% growth in the same period.
From 2014 to 2023, Cisco's EBITDA peaked in 2023, reaching approximately $17.5 billion, while Lam's EBITDA saw its zenith in 2022 at around $5.7 billion. This period highlights Cisco's steady dominance, yet Lam's rapid ascent in the semiconductor sector cannot be overlooked. As we move forward, the question remains: will Lam continue its upward momentum, or will Cisco maintain its lead in this dynamic industry?
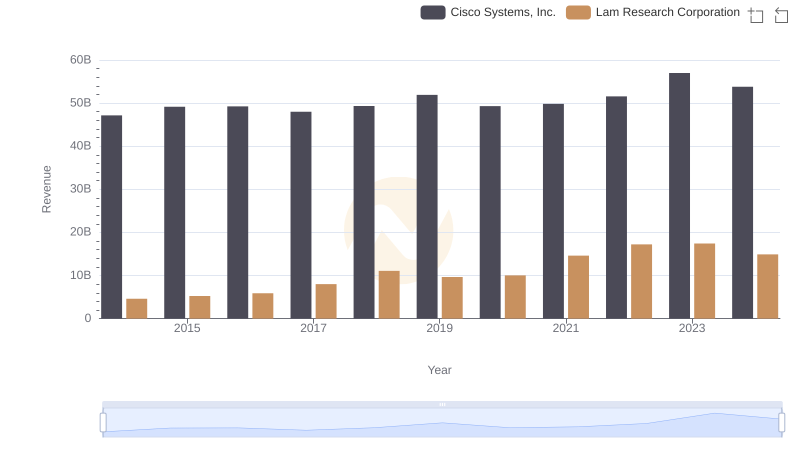
Cisco Systems, Inc. or Lam Research Corporation: Who Leads in Yearly Revenue?
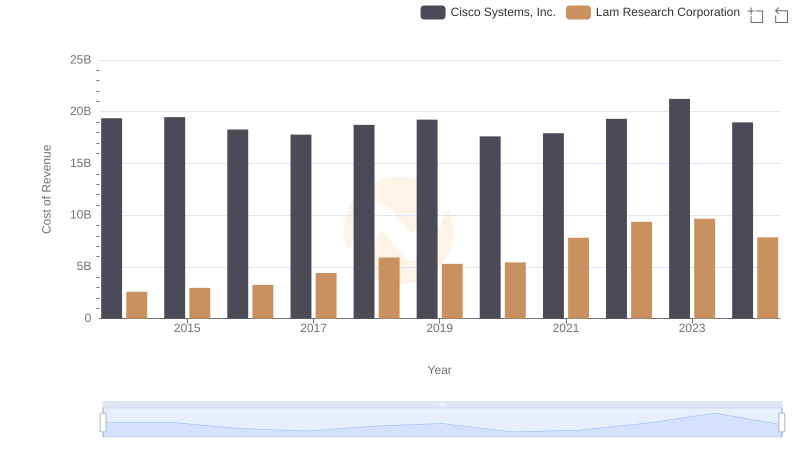
Analyzing Cost of Revenue: Cisco Systems, Inc. and Lam Research Corporation
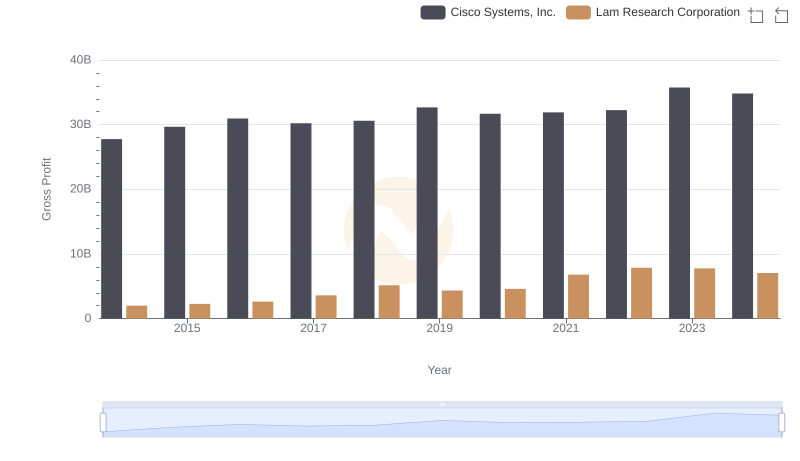
Who Generates Higher Gross Profit? Cisco Systems, Inc. or Lam Research Corporation
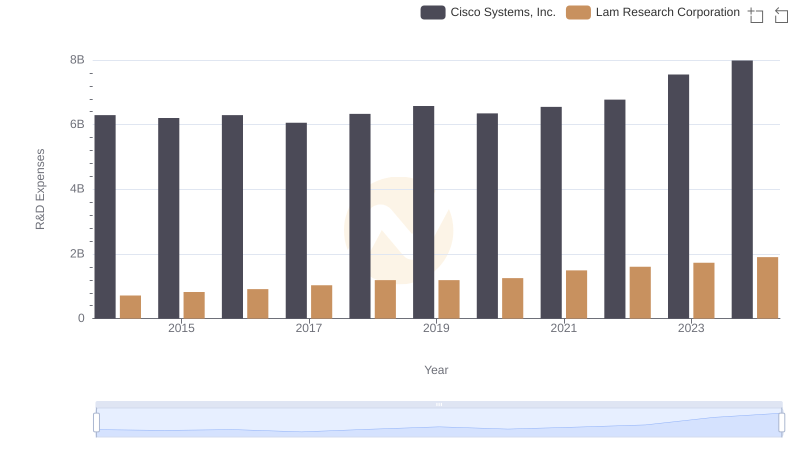
Research and Development Investment: Cisco Systems, Inc. vs Lam Research Corporation
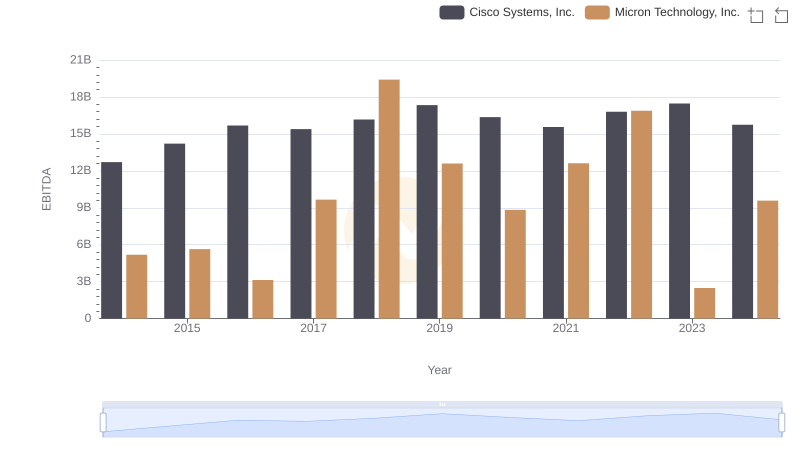
A Side-by-Side Analysis of EBITDA: Cisco Systems, Inc. and Micron Technology, Inc.
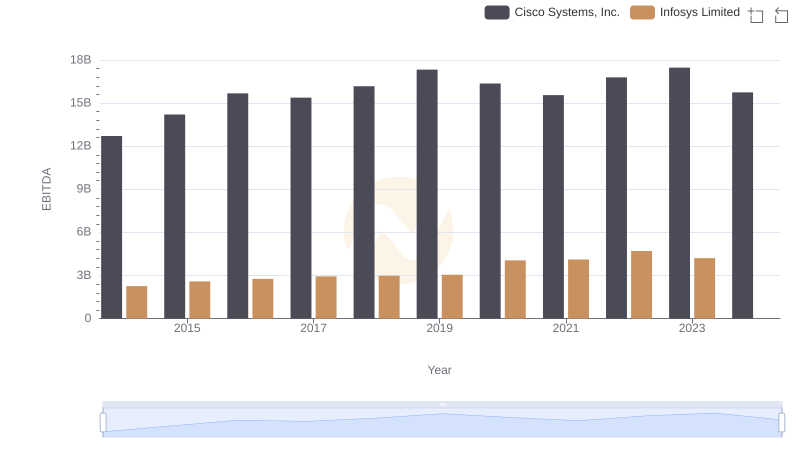
Professional EBITDA Benchmarking: Cisco Systems, Inc. vs Infosys Limited
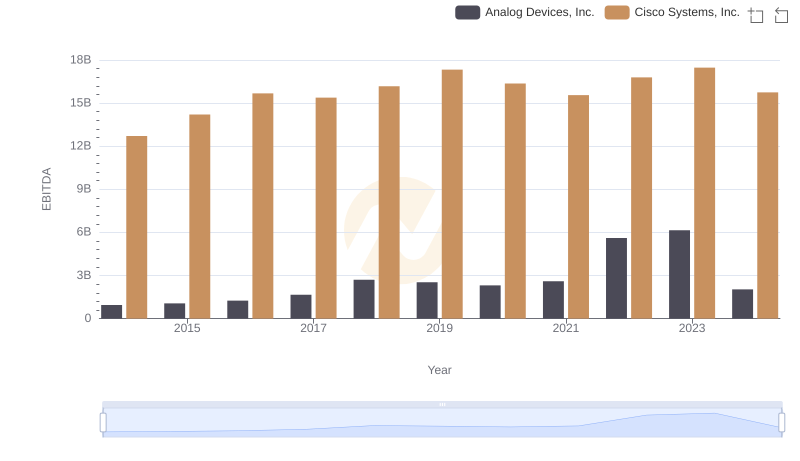
Cisco Systems, Inc. vs Analog Devices, Inc.: In-Depth EBITDA Performance Comparison
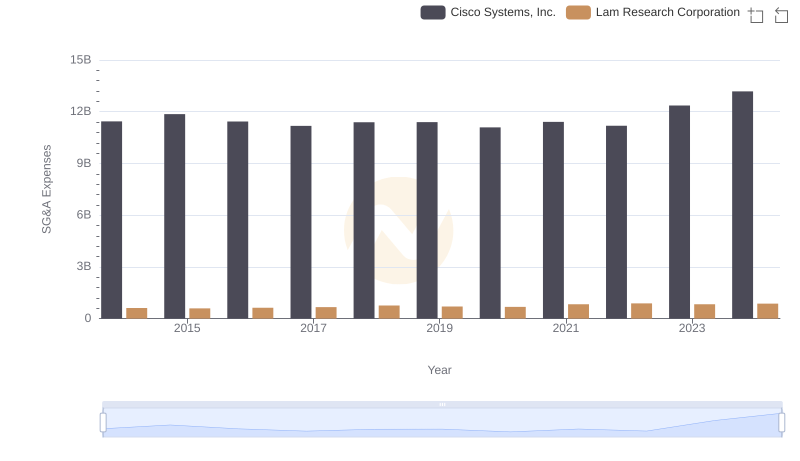
Who Optimizes SG&A Costs Better? Cisco Systems, Inc. or Lam Research Corporation
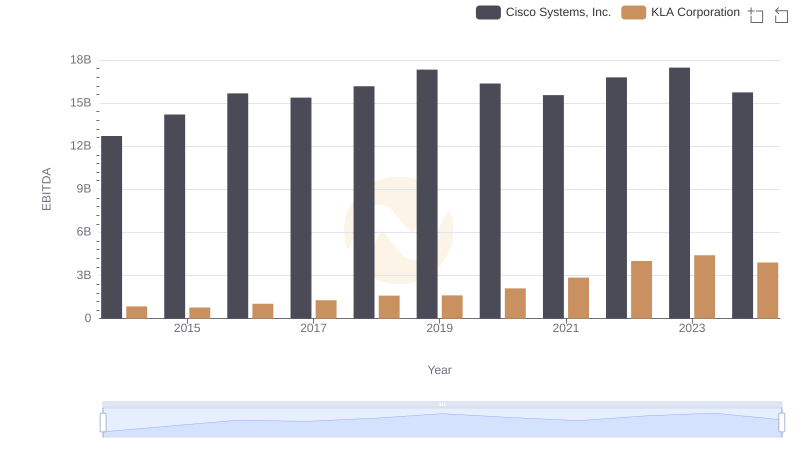
A Professional Review of EBITDA: Cisco Systems, Inc. Compared to KLA Corporation
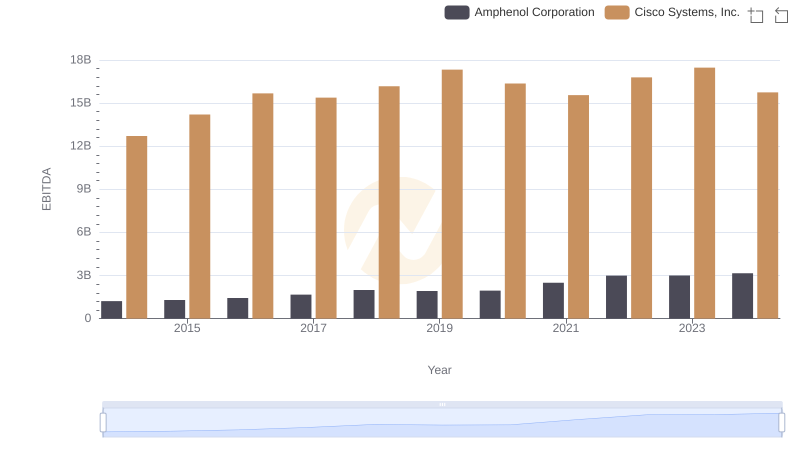
Comprehensive EBITDA Comparison: Cisco Systems, Inc. vs Amphenol Corporation
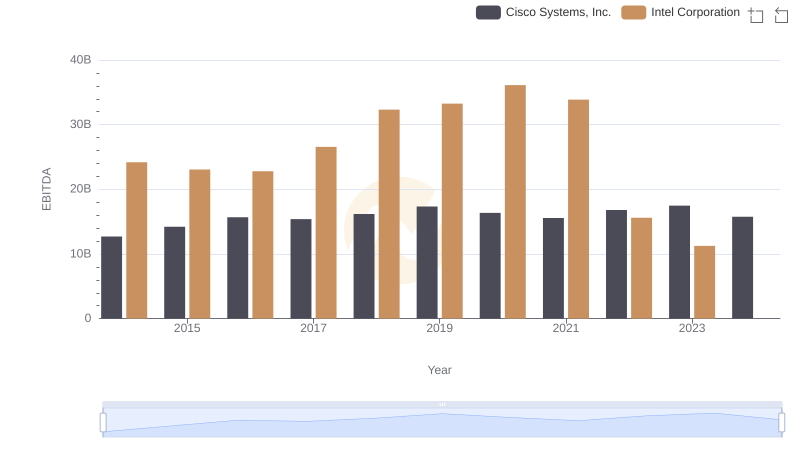
EBITDA Metrics Evaluated: Cisco Systems, Inc. vs Intel Corporation
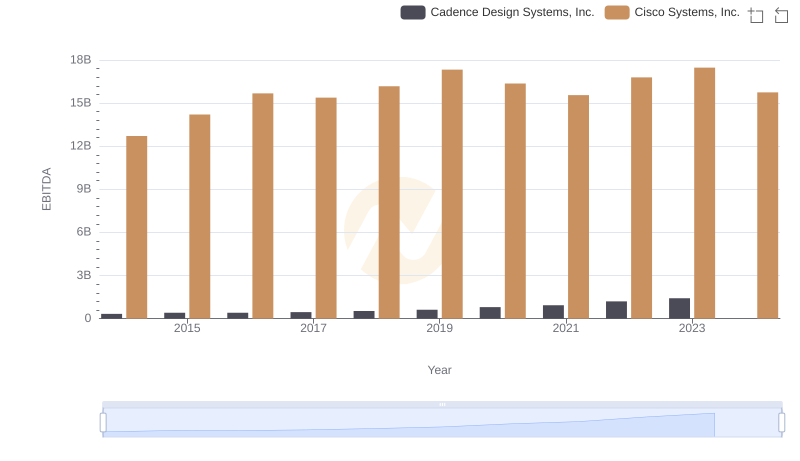
Professional EBITDA Benchmarking: Cisco Systems, Inc. vs Cadence Design Systems, Inc.