| __timestamp | Automatic Data Processing, Inc. | Pool Corporation |
|---|---|---|
| Wednesday, January 1, 2014 | 7221400000 | 1603222000 |
| Thursday, January 1, 2015 | 6427600000 | 1687495000 |
| Friday, January 1, 2016 | 6840300000 | 1829716000 |
| Sunday, January 1, 2017 | 7269800000 | 1982899000 |
| Monday, January 1, 2018 | 7842600000 | 2127924000 |
| Tuesday, January 1, 2019 | 8086600000 | 2274592000 |
| Wednesday, January 1, 2020 | 8445100000 | 2805721000 |
| Friday, January 1, 2021 | 8640300000 | 3678492000 |
| Saturday, January 1, 2022 | 9461900000 | 4246315000 |
| Sunday, January 1, 2023 | 9953400000 | 3881551000 |
| Monday, January 1, 2024 | 10476700000 |
Unleashing the power of data
In the ever-evolving landscape of corporate finance, understanding the cost of revenue is crucial for assessing a company's efficiency and profitability. This analysis delves into the financial journeys of Automatic Data Processing, Inc. (ADP) and Pool Corporation over the past decade. From 2014 to 2023, ADP's cost of revenue has seen a steady increase, peaking at approximately $10.5 billion in 2023, marking a 45% rise from 2014. Meanwhile, Pool Corporation's cost of revenue surged by 142% from 2014 to 2022, before experiencing a slight dip in 2023. This trend highlights the dynamic nature of operational costs in different industries. While ADP's growth reflects its expanding service offerings, Pool Corporation's fluctuations may indicate seasonal or market-driven factors. Missing data for 2024 suggests ongoing changes, inviting further exploration into these companies' financial strategies.
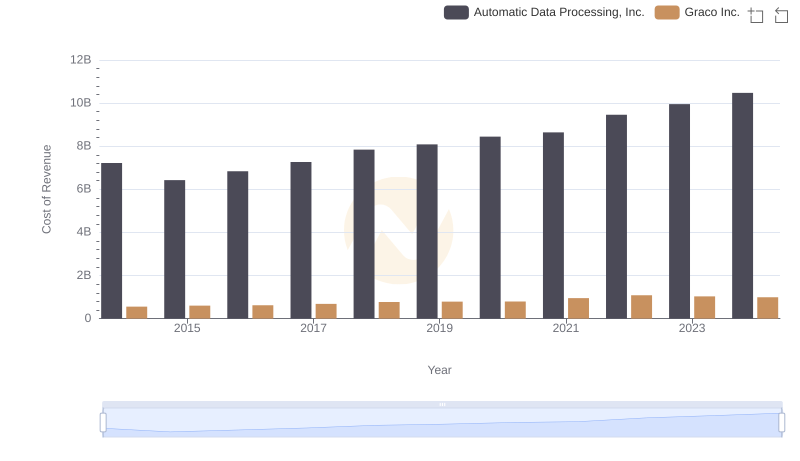
Cost of Revenue: Key Insights for Automatic Data Processing, Inc. and Graco Inc.
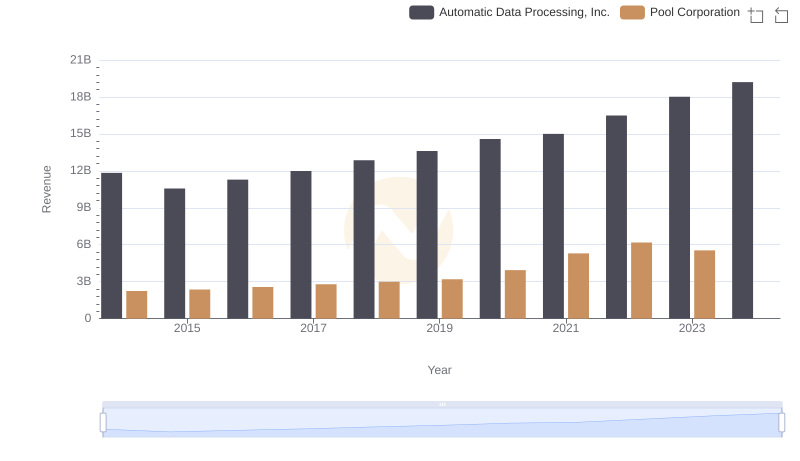
Revenue Showdown: Automatic Data Processing, Inc. vs Pool Corporation
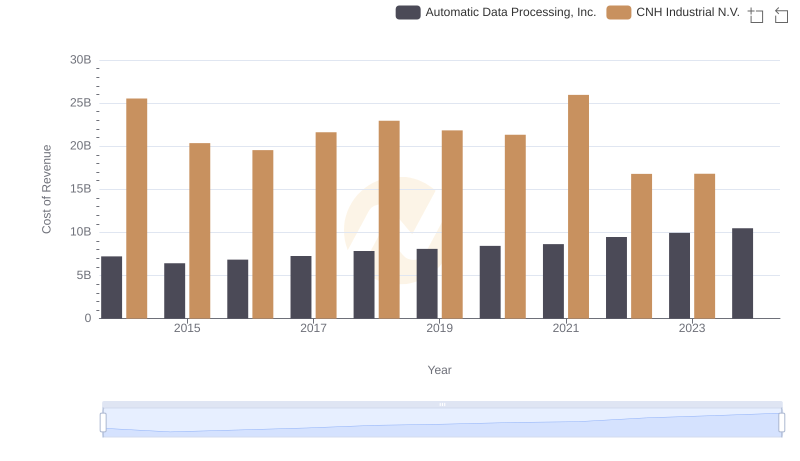
Automatic Data Processing, Inc. vs CNH Industrial N.V.: Efficiency in Cost of Revenue Explored
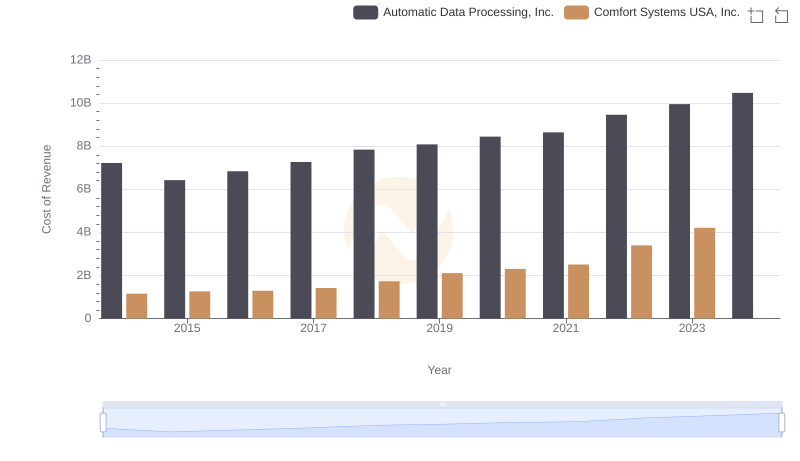
Automatic Data Processing, Inc. vs Comfort Systems USA, Inc.: Efficiency in Cost of Revenue Explored
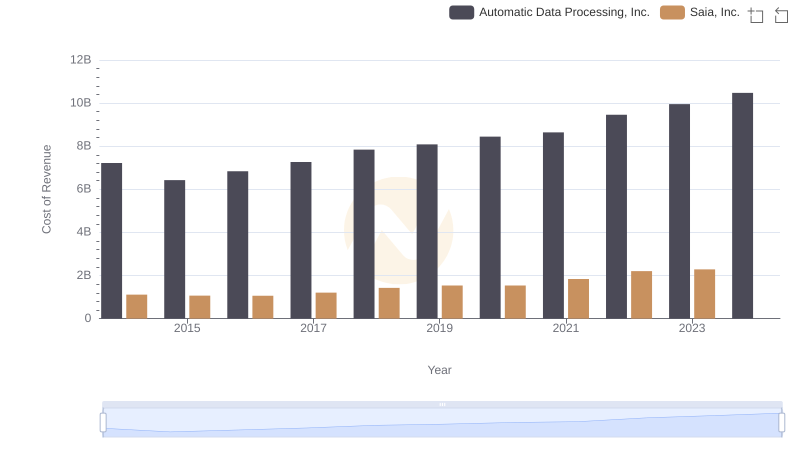
Cost Insights: Breaking Down Automatic Data Processing, Inc. and Saia, Inc.'s Expenses
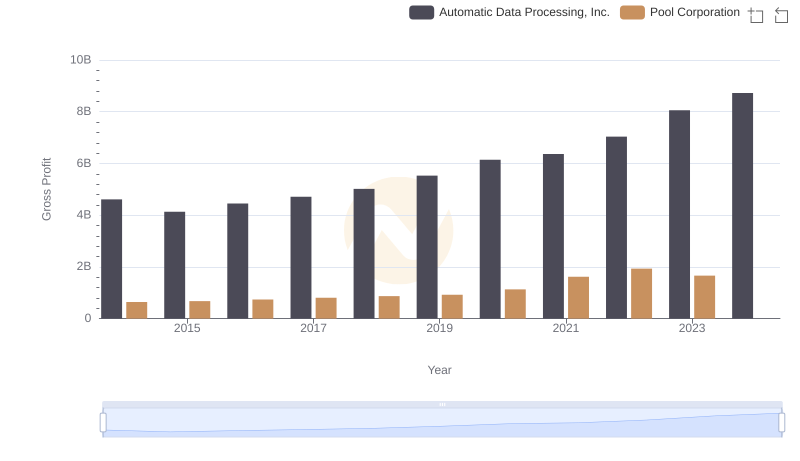
Gross Profit Comparison: Automatic Data Processing, Inc. and Pool Corporation Trends
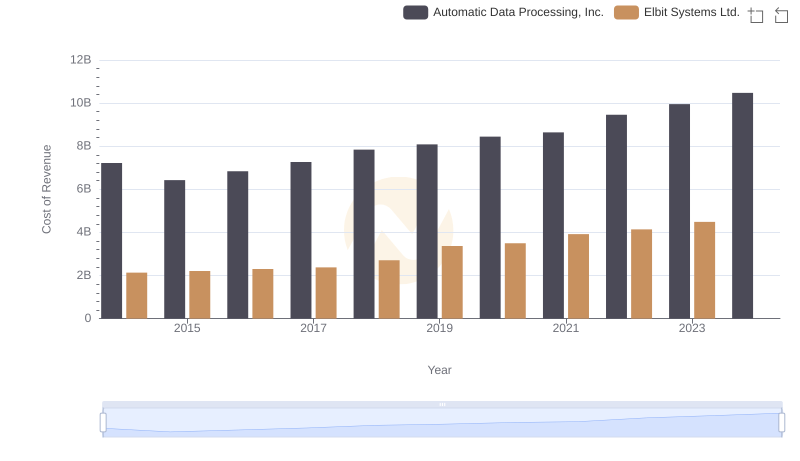
Automatic Data Processing, Inc. vs Elbit Systems Ltd.: Efficiency in Cost of Revenue Explored
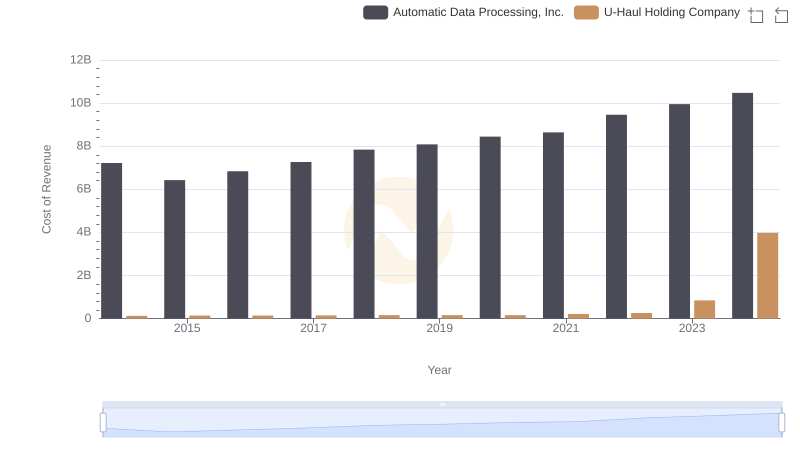
Cost of Revenue Trends: Automatic Data Processing, Inc. vs U-Haul Holding Company
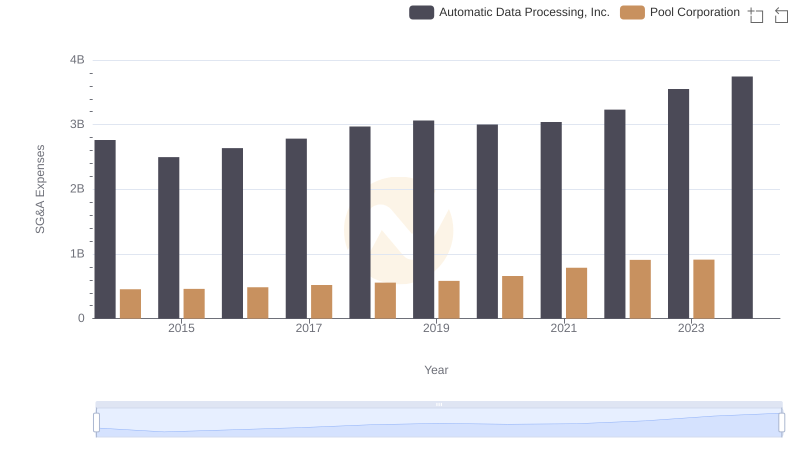
Cost Management Insights: SG&A Expenses for Automatic Data Processing, Inc. and Pool Corporation
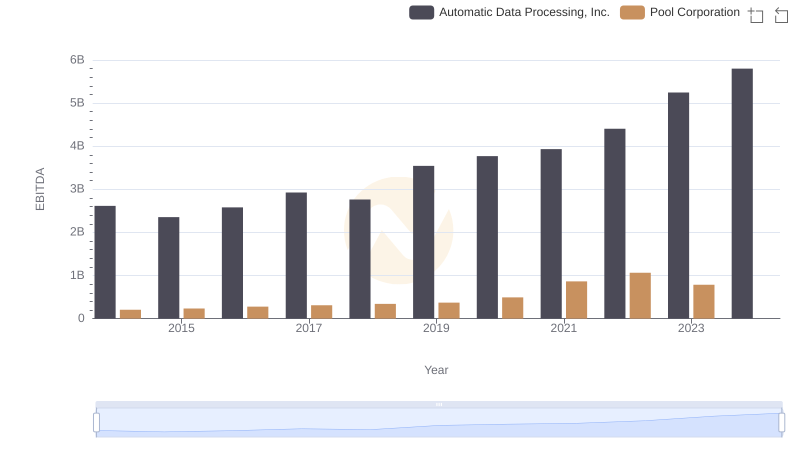
Professional EBITDA Benchmarking: Automatic Data Processing, Inc. vs Pool Corporation