| __timestamp | Automatic Data Processing, Inc. | Comfort Systems USA, Inc. |
|---|---|---|
| Wednesday, January 1, 2014 | 7221400000 | 1161024000 |
| Thursday, January 1, 2015 | 6427600000 | 1262390000 |
| Friday, January 1, 2016 | 6840300000 | 1290331000 |
| Sunday, January 1, 2017 | 7269800000 | 1421641000 |
| Monday, January 1, 2018 | 7842600000 | 1736600000 |
| Tuesday, January 1, 2019 | 8086600000 | 2113334000 |
| Wednesday, January 1, 2020 | 8445100000 | 2309676000 |
| Friday, January 1, 2021 | 8640300000 | 2510429000 |
| Saturday, January 1, 2022 | 9461900000 | 3398756000 |
| Sunday, January 1, 2023 | 9953400000 | 4216251000 |
| Monday, January 1, 2024 | 10476700000 |
Unlocking the unknown
In the ever-evolving landscape of corporate finance, understanding cost efficiency is paramount. This analysis delves into the cost of revenue trends for Automatic Data Processing, Inc. (ADP) and Comfort Systems USA, Inc. over the past decade. From 2014 to 2023, ADP's cost of revenue has seen a steady increase, peaking at approximately $10.5 billion in 2023, marking a 45% rise from 2014. In contrast, Comfort Systems USA, Inc. has experienced a more dramatic growth, with its cost of revenue surging by 263% from 2014 to 2023, reaching $4.2 billion. This stark difference highlights Comfort Systems' aggressive expansion strategy compared to ADP's more stable growth. Notably, data for 2024 is incomplete, indicating potential shifts in these trends. As businesses navigate the complexities of cost management, these insights offer a valuable perspective on strategic financial planning.
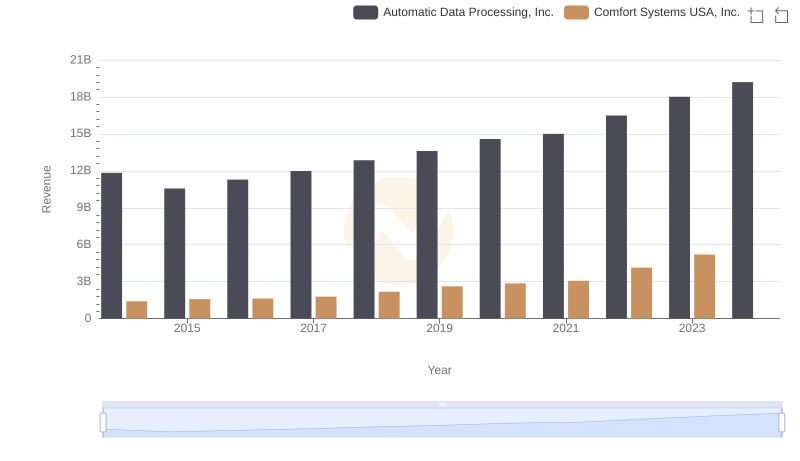
Automatic Data Processing, Inc. vs Comfort Systems USA, Inc.: Examining Key Revenue Metrics
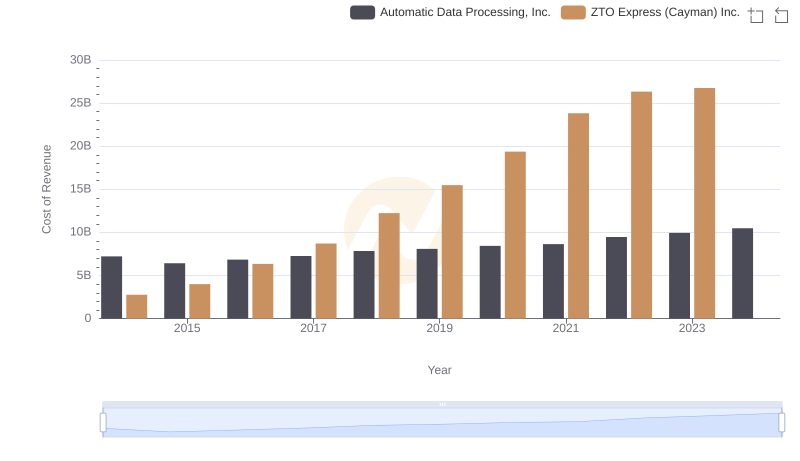
Cost of Revenue Comparison: Automatic Data Processing, Inc. vs ZTO Express (Cayman) Inc.
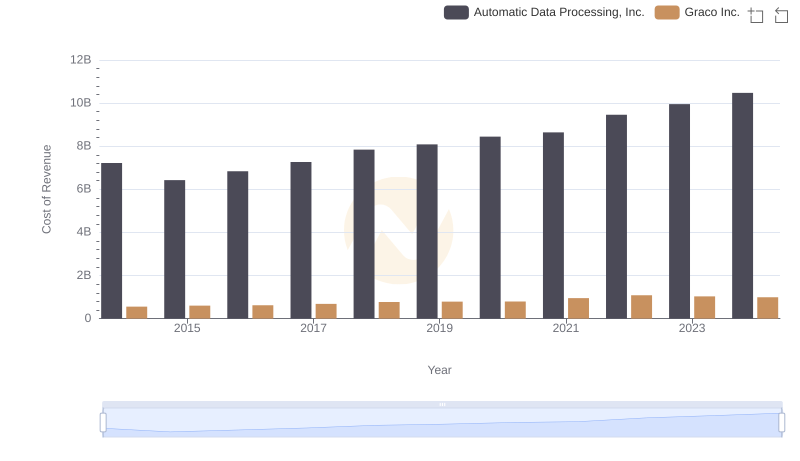
Cost of Revenue: Key Insights for Automatic Data Processing, Inc. and Graco Inc.
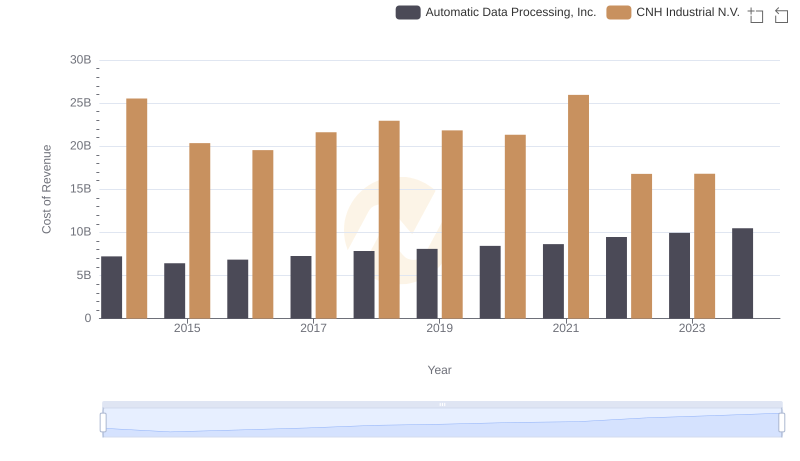
Automatic Data Processing, Inc. vs CNH Industrial N.V.: Efficiency in Cost of Revenue Explored
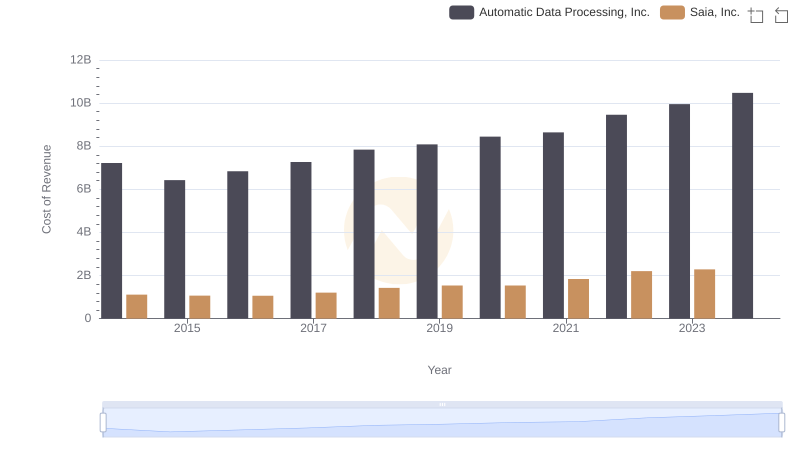
Cost Insights: Breaking Down Automatic Data Processing, Inc. and Saia, Inc.'s Expenses
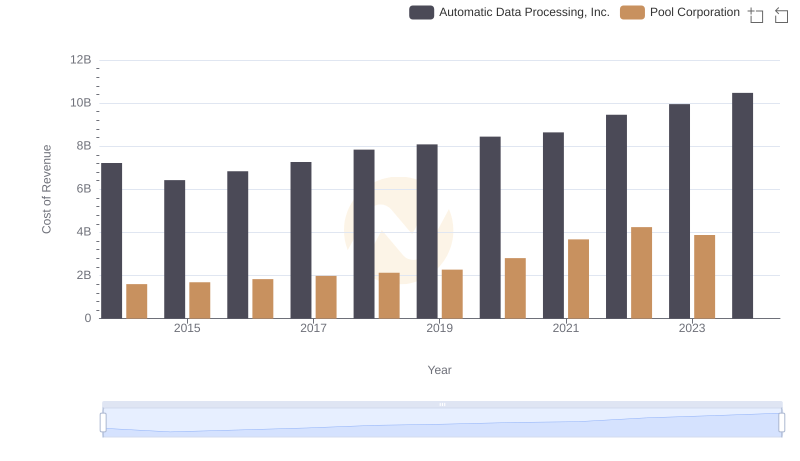
Analyzing Cost of Revenue: Automatic Data Processing, Inc. and Pool Corporation
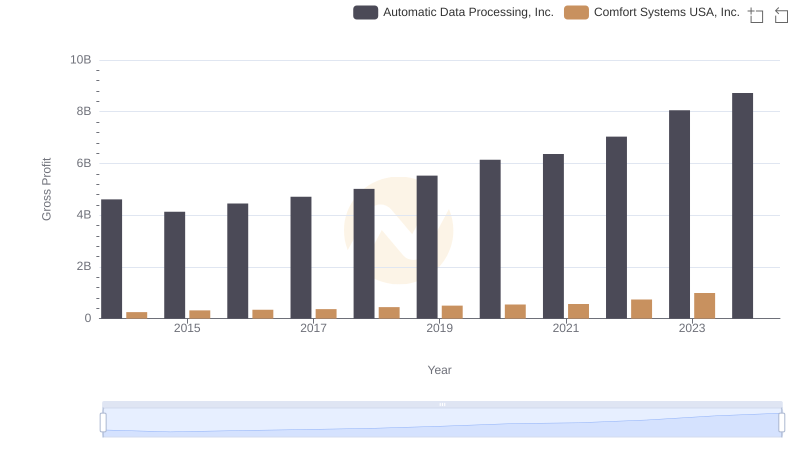
Gross Profit Comparison: Automatic Data Processing, Inc. and Comfort Systems USA, Inc. Trends
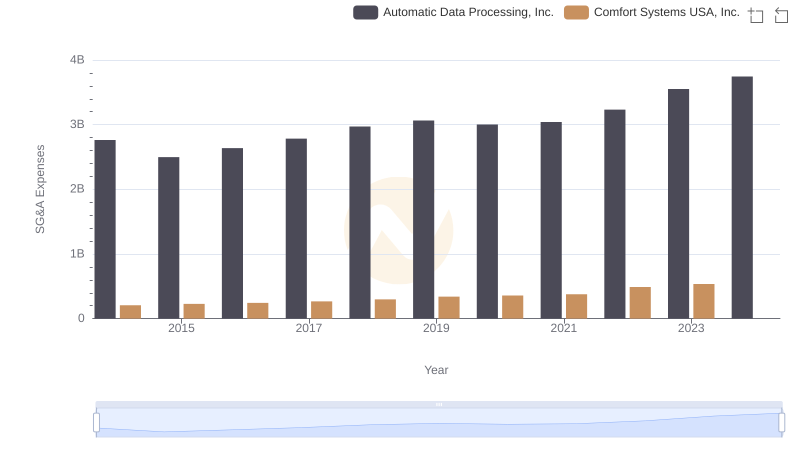
Automatic Data Processing, Inc. or Comfort Systems USA, Inc.: Who Manages SG&A Costs Better?
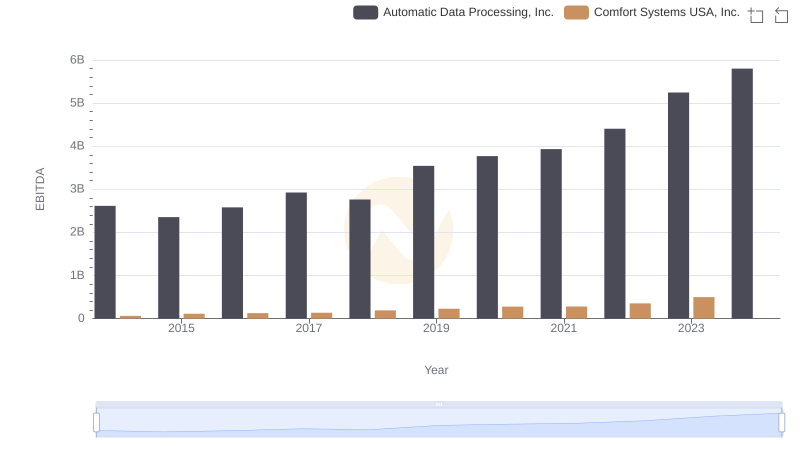
EBITDA Analysis: Evaluating Automatic Data Processing, Inc. Against Comfort Systems USA, Inc.