| __timestamp | Automatic Data Processing, Inc. | U-Haul Holding Company |
|---|---|---|
| Wednesday, January 1, 2014 | 7221400000 | 127270000 |
| Thursday, January 1, 2015 | 6427600000 | 146072000 |
| Friday, January 1, 2016 | 6840300000 | 144990000 |
| Sunday, January 1, 2017 | 7269800000 | 152485000 |
| Monday, January 1, 2018 | 7842600000 | 160489000 |
| Tuesday, January 1, 2019 | 8086600000 | 162142000 |
| Wednesday, January 1, 2020 | 8445100000 | 164018000 |
| Friday, January 1, 2021 | 8640300000 | 214059000 |
| Saturday, January 1, 2022 | 9461900000 | 259585000 |
| Sunday, January 1, 2023 | 9953400000 | 844894000 |
| Monday, January 1, 2024 | 10476700000 | 3976040000 |
Unveiling the hidden dimensions of data
In the ever-evolving landscape of American business, Automatic Data Processing, Inc. (ADP) and U-Haul Holding Company stand as intriguing case studies in cost management. Over the past decade, ADP has consistently demonstrated a robust growth trajectory in its cost of revenue, with a notable increase of approximately 45% from 2014 to 2024. This reflects the company's strategic investments and expansion in the payroll and human resources sector.
Conversely, U-Haul's cost of revenue has seen a dramatic surge, particularly in recent years. From a modest 127 million in 2014, it skyrocketed to nearly 4 billion by 2024, marking an astonishing 3,000% increase. This sharp rise underscores U-Haul's aggressive expansion and adaptation to the growing demand for mobility solutions.
These trends highlight the diverse strategies and market dynamics influencing two distinct sectors, offering valuable insights for investors and industry analysts alike.
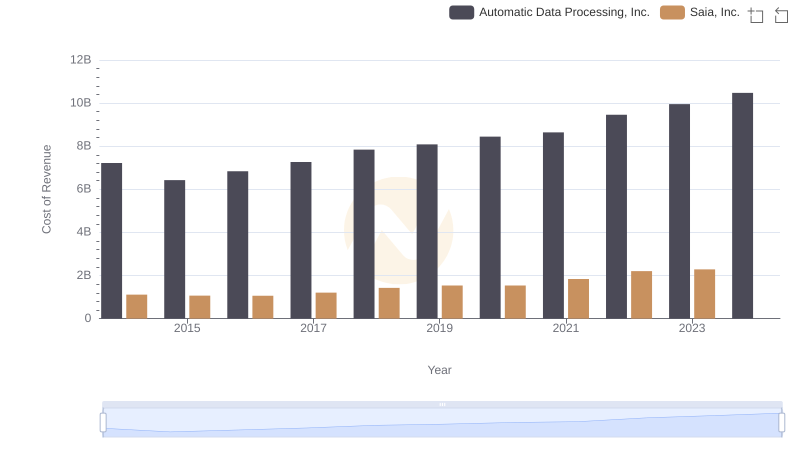
Cost Insights: Breaking Down Automatic Data Processing, Inc. and Saia, Inc.'s Expenses
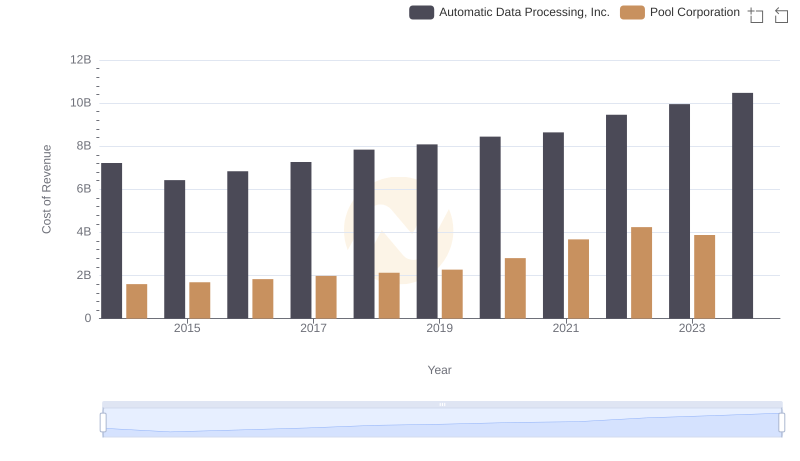
Analyzing Cost of Revenue: Automatic Data Processing, Inc. and Pool Corporation
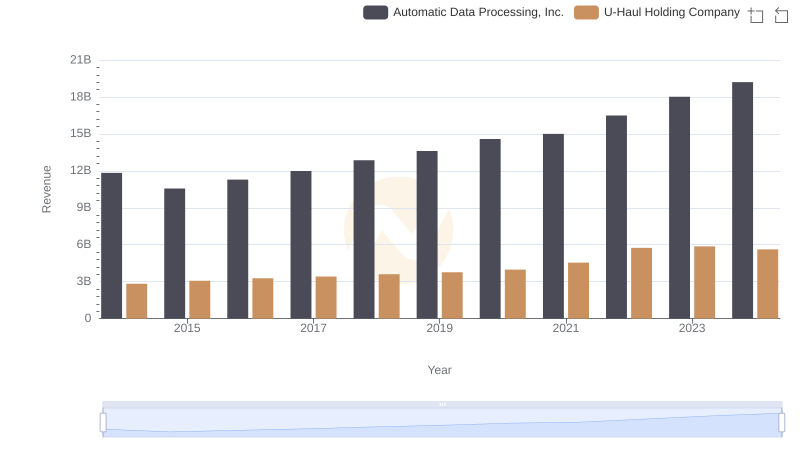
Automatic Data Processing, Inc. or U-Haul Holding Company: Who Leads in Yearly Revenue?
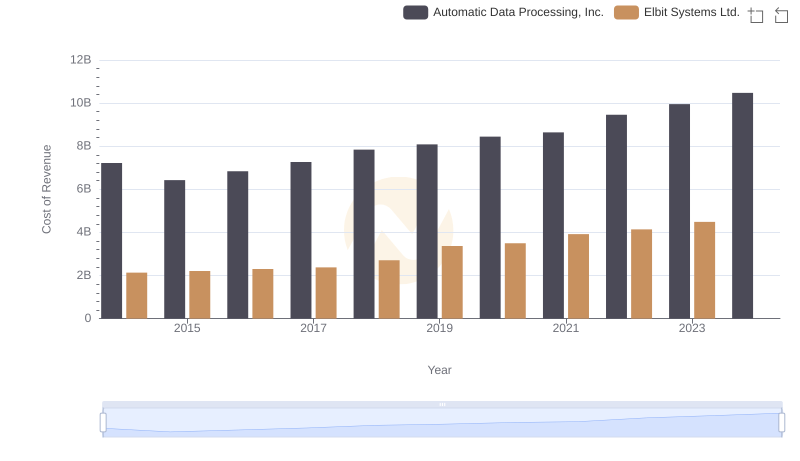
Automatic Data Processing, Inc. vs Elbit Systems Ltd.: Efficiency in Cost of Revenue Explored
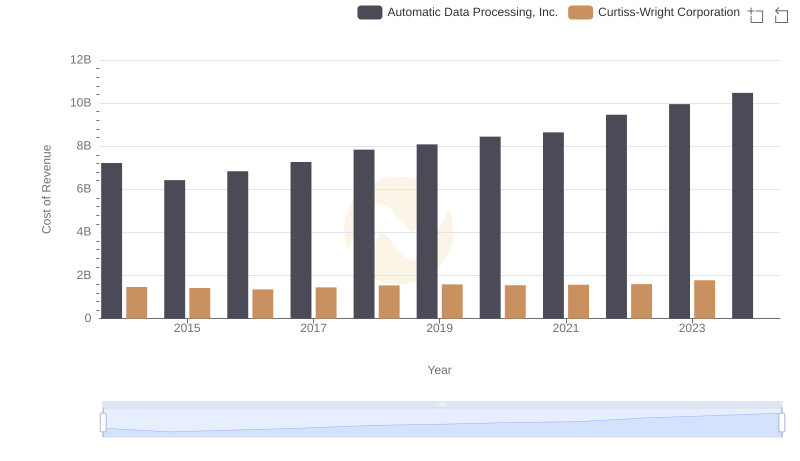
Comparing Cost of Revenue Efficiency: Automatic Data Processing, Inc. vs Curtiss-Wright Corporation
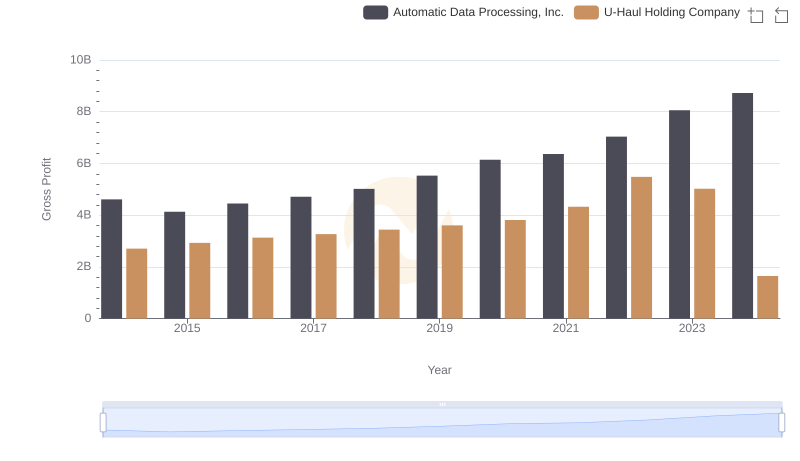
Gross Profit Analysis: Comparing Automatic Data Processing, Inc. and U-Haul Holding Company

Operational Costs Compared: SG&A Analysis of Automatic Data Processing, Inc. and U-Haul Holding Company

A Professional Review of EBITDA: Automatic Data Processing, Inc. Compared to U-Haul Holding Company