| __timestamp | Automatic Data Processing, Inc. | CNH Industrial N.V. |
|---|---|---|
| Wednesday, January 1, 2014 | 7221400000 | 25534000000 |
| Thursday, January 1, 2015 | 6427600000 | 20357000000 |
| Friday, January 1, 2016 | 6840300000 | 19539000000 |
| Sunday, January 1, 2017 | 7269800000 | 21621000000 |
| Monday, January 1, 2018 | 7842600000 | 22958000000 |
| Tuesday, January 1, 2019 | 8086600000 | 21832000000 |
| Wednesday, January 1, 2020 | 8445100000 | 21327000000 |
| Friday, January 1, 2021 | 8640300000 | 25951000000 |
| Saturday, January 1, 2022 | 9461900000 | 16797000000 |
| Sunday, January 1, 2023 | 9953400000 | 16805000000 |
| Monday, January 1, 2024 | 10476700000 |
Unleashing the power of data
In the ever-evolving landscape of global business, understanding cost efficiency is paramount. This analysis delves into the cost of revenue trends for Automatic Data Processing, Inc. (ADP) and CNH Industrial N.V. from 2014 to 2023. Over this decade, ADP's cost of revenue has shown a steady increase, rising approximately 45% from 2014 to 2023. In contrast, CNH Industrial experienced a more volatile trajectory, with a notable peak in 2021, followed by a significant drop of about 35% by 2023.
This comparative analysis highlights the importance of strategic cost management in maintaining competitive advantage.
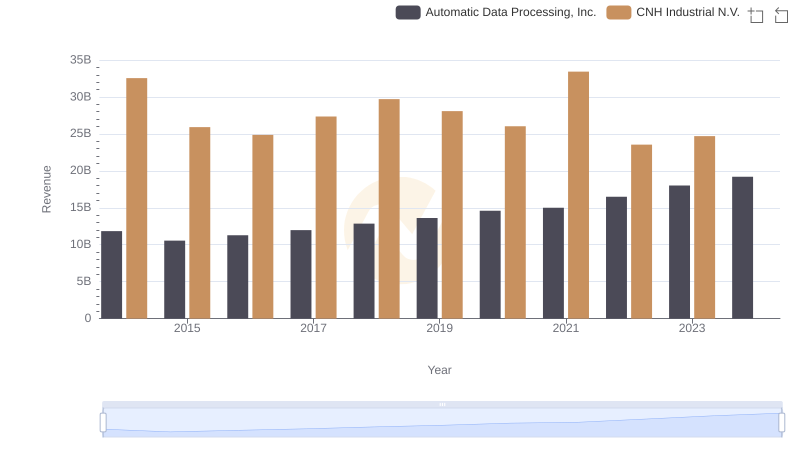
Automatic Data Processing, Inc. and CNH Industrial N.V.: A Comprehensive Revenue Analysis
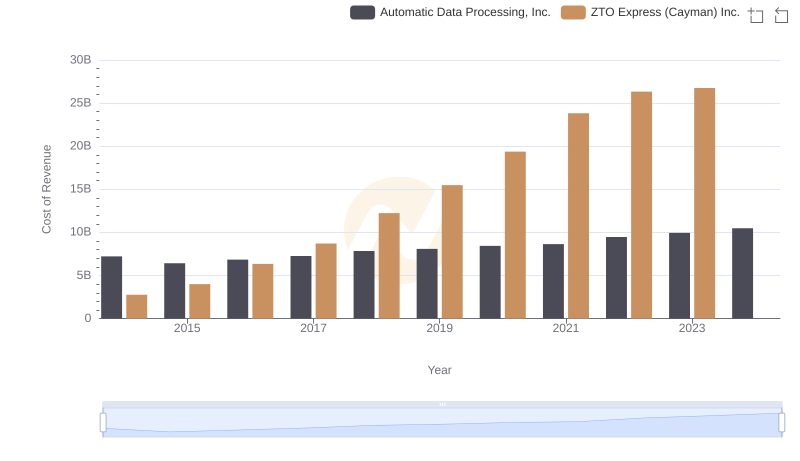
Cost of Revenue Comparison: Automatic Data Processing, Inc. vs ZTO Express (Cayman) Inc.
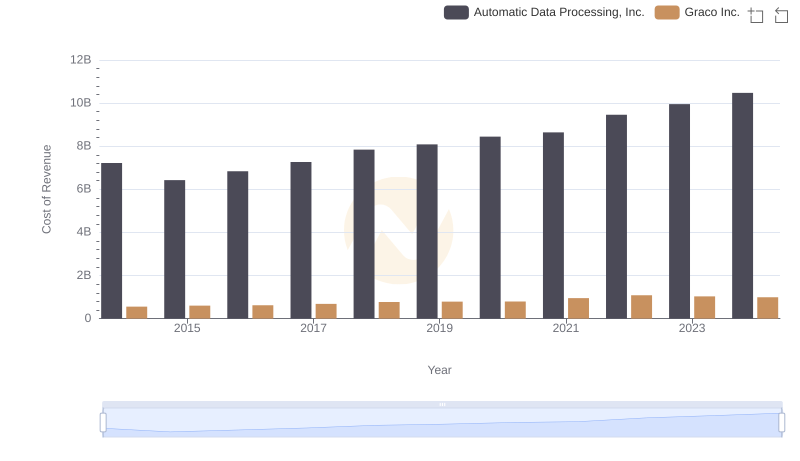
Cost of Revenue: Key Insights for Automatic Data Processing, Inc. and Graco Inc.
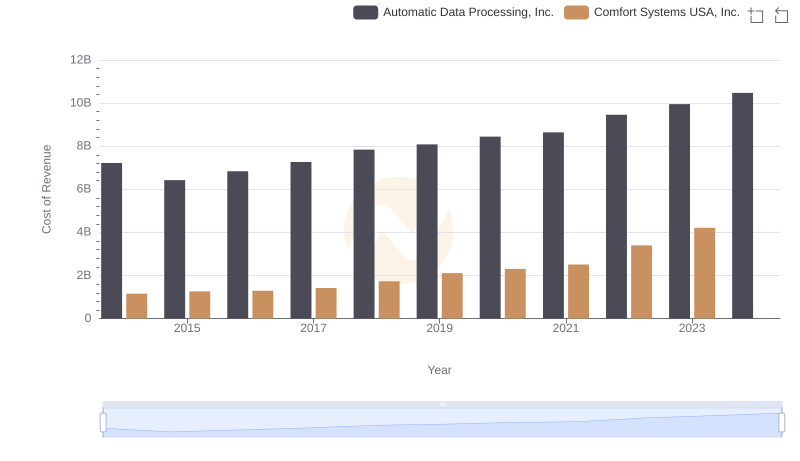
Automatic Data Processing, Inc. vs Comfort Systems USA, Inc.: Efficiency in Cost of Revenue Explored
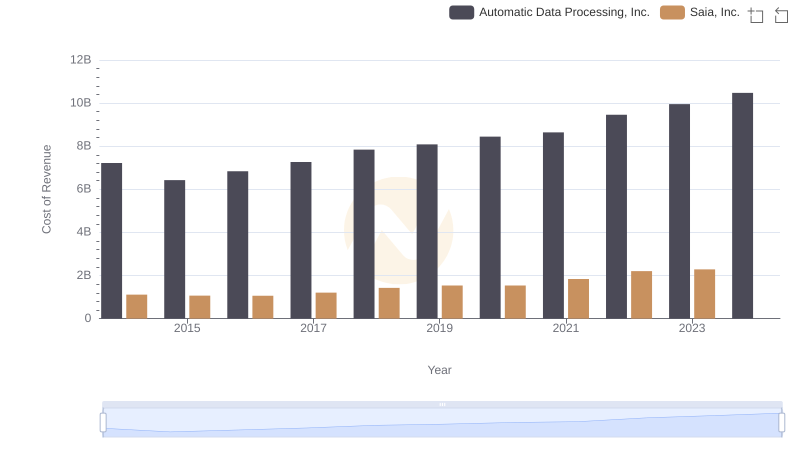
Cost Insights: Breaking Down Automatic Data Processing, Inc. and Saia, Inc.'s Expenses
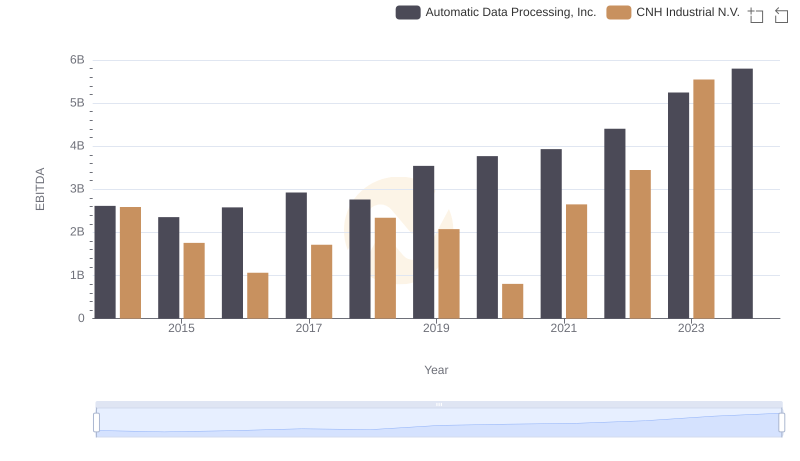
Automatic Data Processing, Inc. vs CNH Industrial N.V.: In-Depth EBITDA Performance Comparison