| __timestamp | AMETEK, Inc. | Saia, Inc. |
|---|---|---|
| Wednesday, January 1, 2014 | 4021964000 | 1272321000 |
| Thursday, January 1, 2015 | 3974295000 | 1221311000 |
| Friday, January 1, 2016 | 3840087000 | 1218481000 |
| Sunday, January 1, 2017 | 4300170000 | 1378510000 |
| Monday, January 1, 2018 | 4845872000 | 1653849000 |
| Tuesday, January 1, 2019 | 5158557000 | 1786735000 |
| Wednesday, January 1, 2020 | 4540029000 | 1822366000 |
| Friday, January 1, 2021 | 5546514000 | 2288704000 |
| Saturday, January 1, 2022 | 6150530000 | 2792057000 |
| Sunday, January 1, 2023 | 6596950000 | 2881433000 |
| Monday, January 1, 2024 | 6941180000 |
Unveiling the hidden dimensions of data
In the competitive landscape of American industry, AMETEK, Inc. and Saia, Inc. have showcased remarkable revenue trajectories over the past decade. From 2014 to 2023, AMETEK, Inc. has consistently outperformed Saia, Inc., with its revenue growing by approximately 64%, reaching a peak of $6.6 billion in 2023. In contrast, Saia, Inc. has demonstrated a robust growth of 126%, with its revenue climbing to nearly $2.9 billion in the same period.
This revenue showdown underscores the dynamic nature of these companies and their strategic maneuvers in the ever-evolving market.
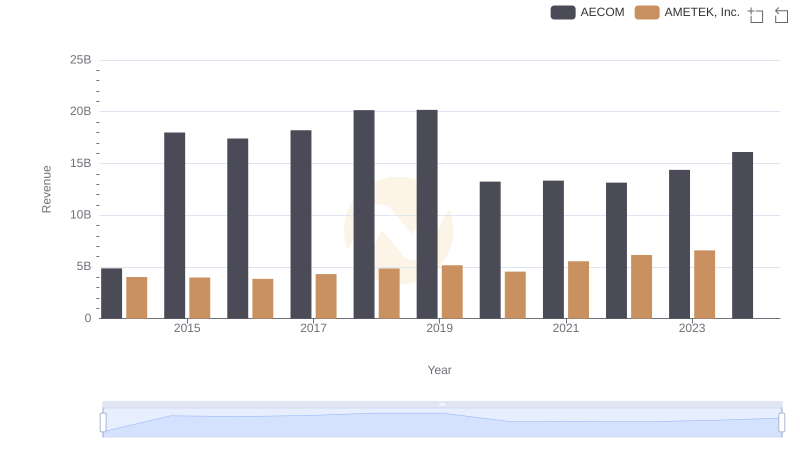
Who Generates More Revenue? AMETEK, Inc. or AECOM
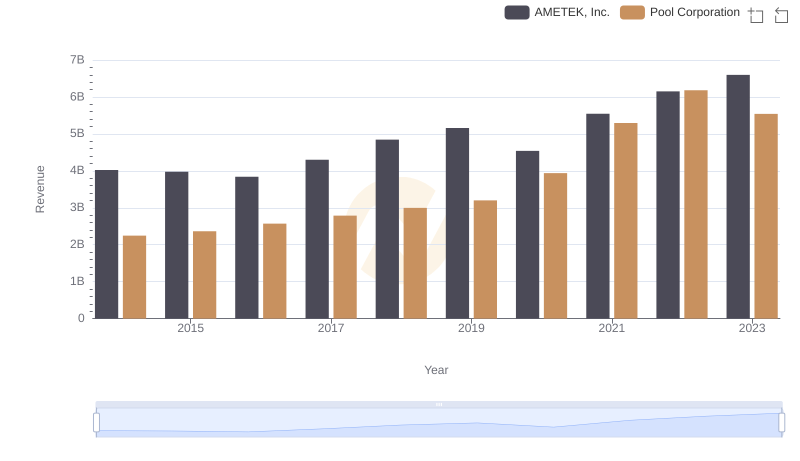
AMETEK, Inc. vs Pool Corporation: Annual Revenue Growth Compared
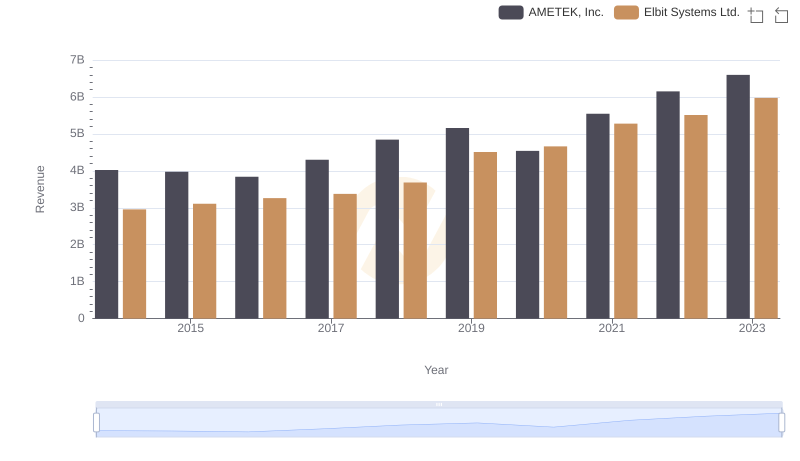
Revenue Insights: AMETEK, Inc. and Elbit Systems Ltd. Performance Compared
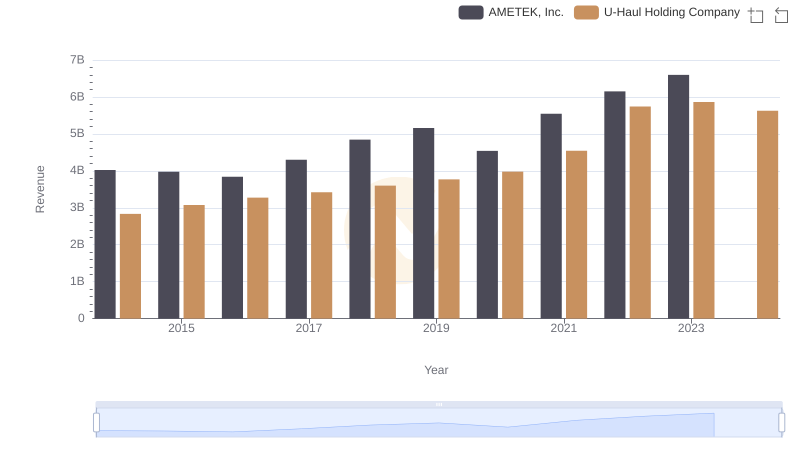
AMETEK, Inc. vs U-Haul Holding Company: Annual Revenue Growth Compared
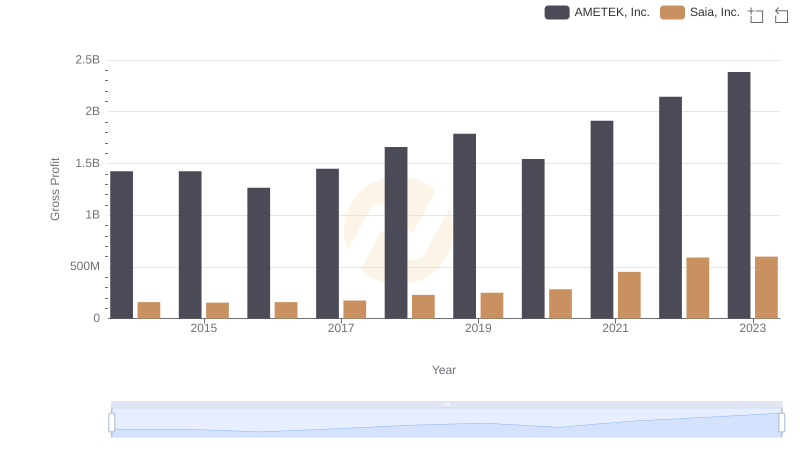
Gross Profit Trends Compared: AMETEK, Inc. vs Saia, Inc.
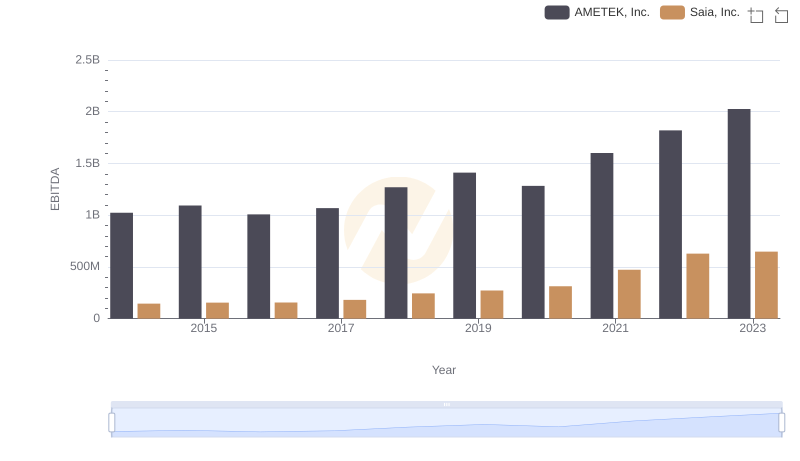
AMETEK, Inc. vs Saia, Inc.: In-Depth EBITDA Performance Comparison