| __timestamp | AMETEK, Inc. | IDEX Corporation |
|---|---|---|
| Wednesday, January 1, 2014 | 4021964000 | 2147767000 |
| Thursday, January 1, 2015 | 3974295000 | 2020668000 |
| Friday, January 1, 2016 | 3840087000 | 2113043000 |
| Sunday, January 1, 2017 | 4300170000 | 2287312000 |
| Monday, January 1, 2018 | 4845872000 | 2483666000 |
| Tuesday, January 1, 2019 | 5158557000 | 2494573000 |
| Wednesday, January 1, 2020 | 4540029000 | 2351646000 |
| Friday, January 1, 2021 | 5546514000 | 2764800000 |
| Saturday, January 1, 2022 | 6150530000 | 3181900000 |
| Sunday, January 1, 2023 | 6596950000 | 3273900000 |
| Monday, January 1, 2024 | 6941180000 | 3268800000 |
Infusing magic into the data realm
In the competitive landscape of industrial technology, AMETEK, Inc. and IDEX Corporation have been key players. Over the past decade, AMETEK has consistently outperformed IDEX in revenue generation. From 2014 to 2023, AMETEK's revenue surged by approximately 64%, reaching a peak of $6.6 billion in 2023. In contrast, IDEX saw a more modest growth of around 52%, with revenues climbing to $3.3 billion in the same year.
AMETEK's revenue growth reflects its strategic acquisitions and expansion into high-growth markets. Meanwhile, IDEX has focused on innovation and customer-centric solutions, which have contributed to its steady revenue increase. Despite the economic challenges of 2020, both companies demonstrated resilience, with AMETEK rebounding strongly in 2021 and IDEX maintaining a steady upward trajectory.
This revenue analysis highlights the dynamic nature of the industrial sector and the strategic maneuvers that define market leadership.
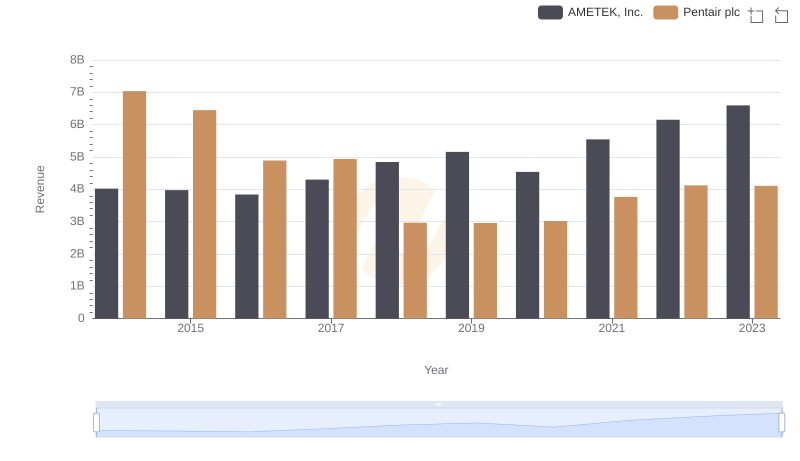
AMETEK, Inc. vs Pentair plc: Annual Revenue Growth Compared
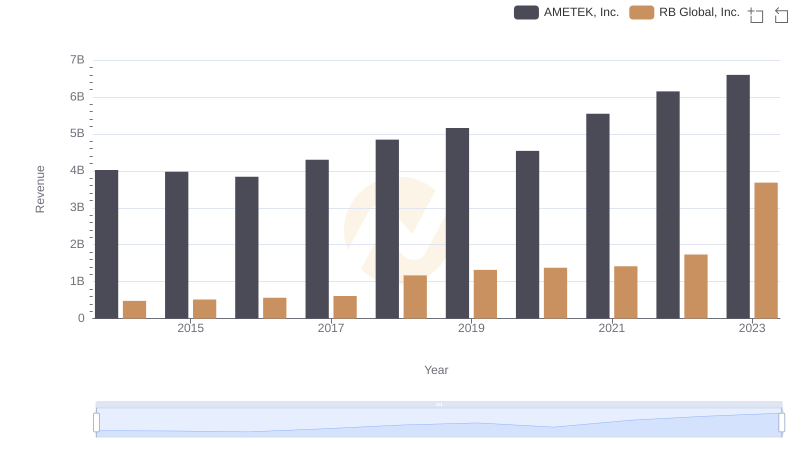
AMETEK, Inc. and RB Global, Inc.: A Comprehensive Revenue Analysis
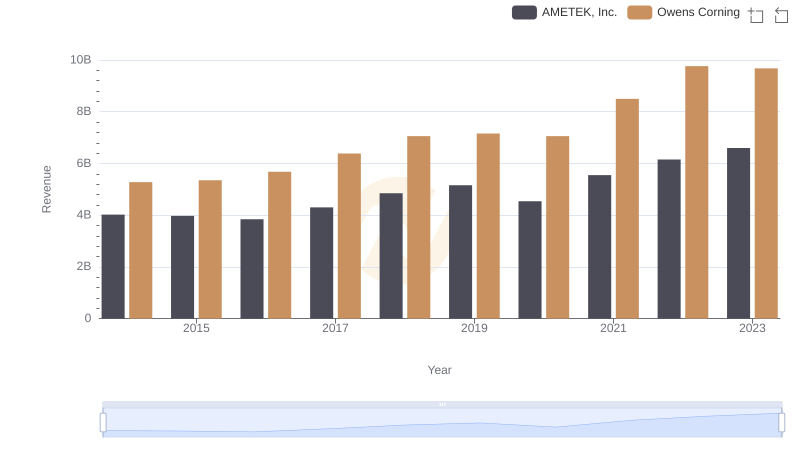
AMETEK, Inc. or Owens Corning: Who Leads in Yearly Revenue?
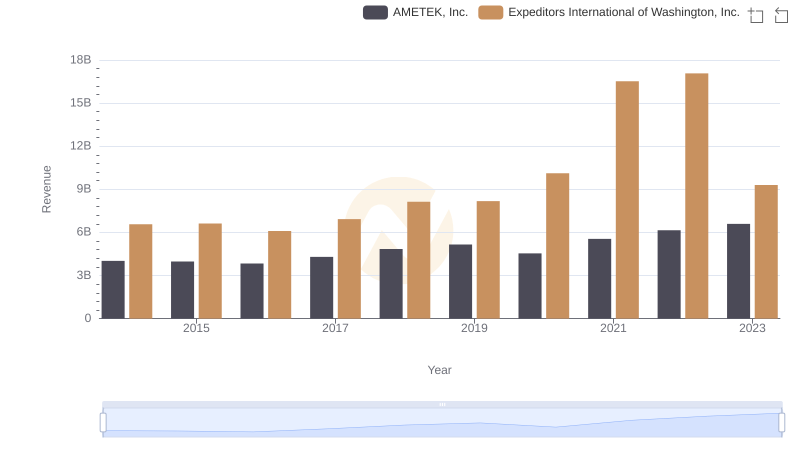
AMETEK, Inc. and Expeditors International of Washington, Inc.: A Comprehensive Revenue Analysis
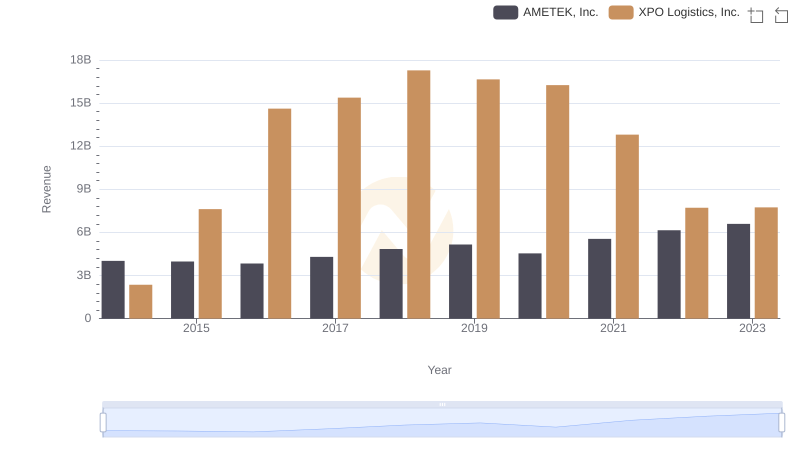
Who Generates More Revenue? AMETEK, Inc. or XPO Logistics, Inc.
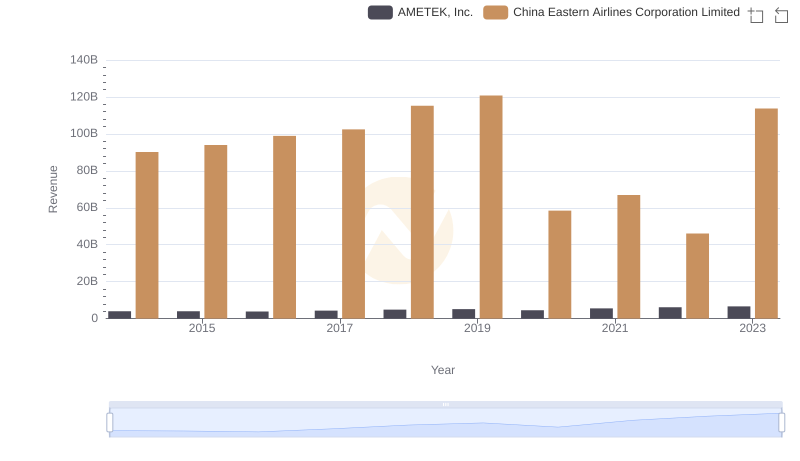
AMETEK, Inc. or China Eastern Airlines Corporation Limited: Who Leads in Yearly Revenue?
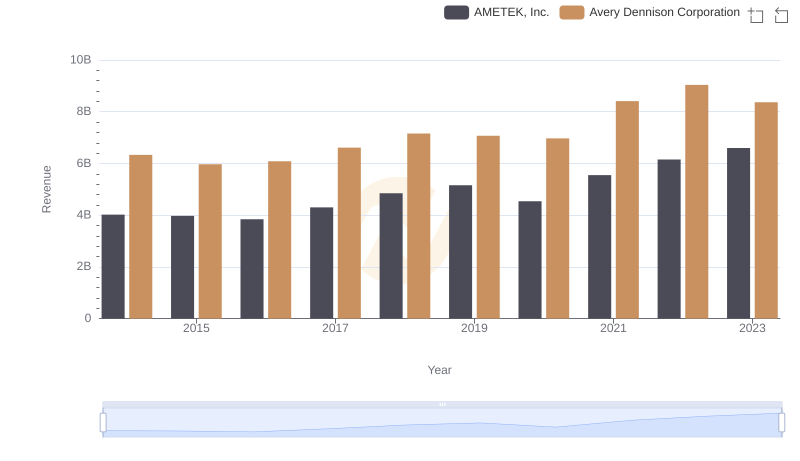
Breaking Down Revenue Trends: AMETEK, Inc. vs Avery Dennison Corporation
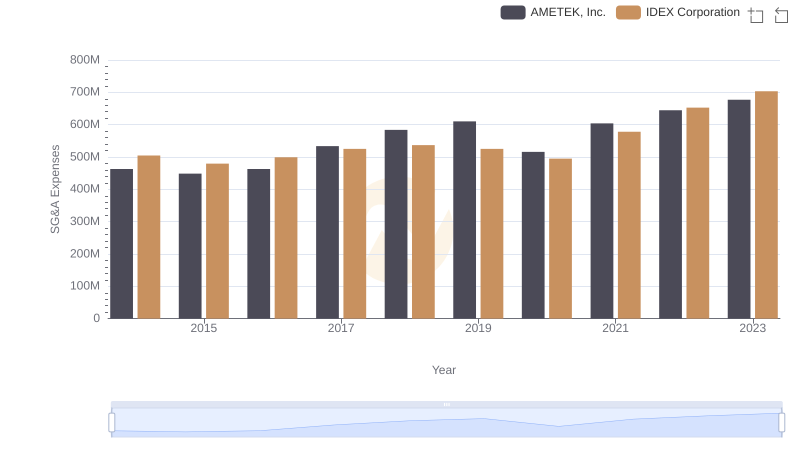
AMETEK, Inc. or IDEX Corporation: Who Manages SG&A Costs Better?