| __timestamp | AMETEK, Inc. | Pentair plc |
|---|---|---|
| Wednesday, January 1, 2014 | 4021964000 | 7039000000 |
| Thursday, January 1, 2015 | 3974295000 | 6449000000 |
| Friday, January 1, 2016 | 3840087000 | 4890000000 |
| Sunday, January 1, 2017 | 4300170000 | 4936500000 |
| Monday, January 1, 2018 | 4845872000 | 2965100000 |
| Tuesday, January 1, 2019 | 5158557000 | 2957200000 |
| Wednesday, January 1, 2020 | 4540029000 | 3017800000 |
| Friday, January 1, 2021 | 5546514000 | 3764800000 |
| Saturday, January 1, 2022 | 6150530000 | 4121800000 |
| Sunday, January 1, 2023 | 6596950000 | 4104500000 |
| Monday, January 1, 2024 | 6941180000 | 4082800000 |
Unleashing the power of data
In the ever-evolving landscape of industrial manufacturing, AMETEK, Inc. and Pentair plc have showcased contrasting revenue trajectories over the past decade. From 2014 to 2023, AMETEK, Inc. has demonstrated a robust growth pattern, with its revenue surging by approximately 64%, from $4.02 billion to $6.60 billion. This consistent upward trend highlights AMETEK's strategic prowess in navigating market challenges and capitalizing on opportunities.
Conversely, Pentair plc experienced a more volatile journey. Starting at $7.04 billion in 2014, its revenue saw a significant dip, reaching a low of $2.96 billion in 2018, before stabilizing around $4.10 billion in 2023. This fluctuation underscores the dynamic nature of the industry and the challenges faced by Pentair in maintaining steady growth.
These insights offer a compelling narrative of resilience and adaptation in the face of economic shifts, providing valuable lessons for investors and industry enthusiasts alike.
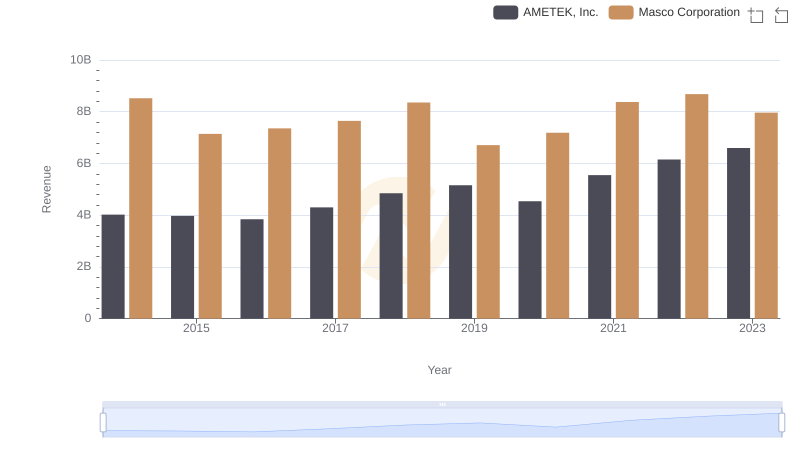
Breaking Down Revenue Trends: AMETEK, Inc. vs Masco Corporation
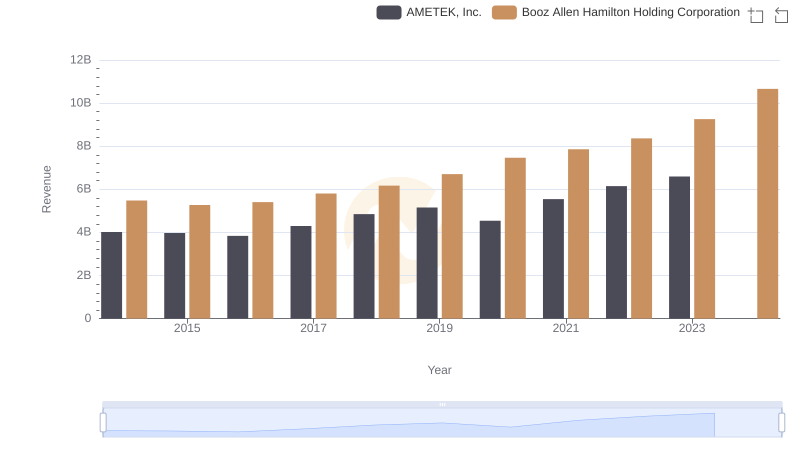
AMETEK, Inc. vs Booz Allen Hamilton Holding Corporation: Examining Key Revenue Metrics
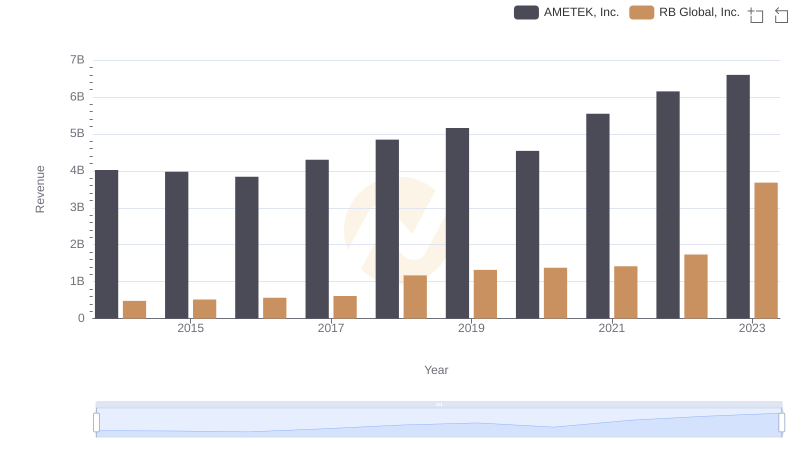
AMETEK, Inc. and RB Global, Inc.: A Comprehensive Revenue Analysis
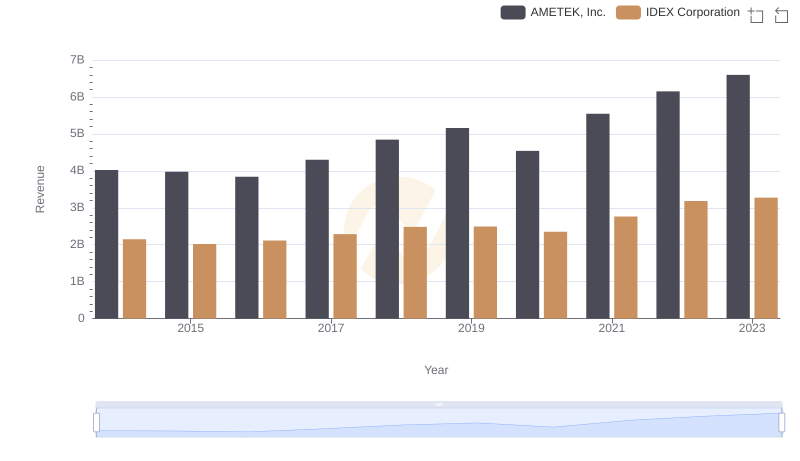
Who Generates More Revenue? AMETEK, Inc. or IDEX Corporation
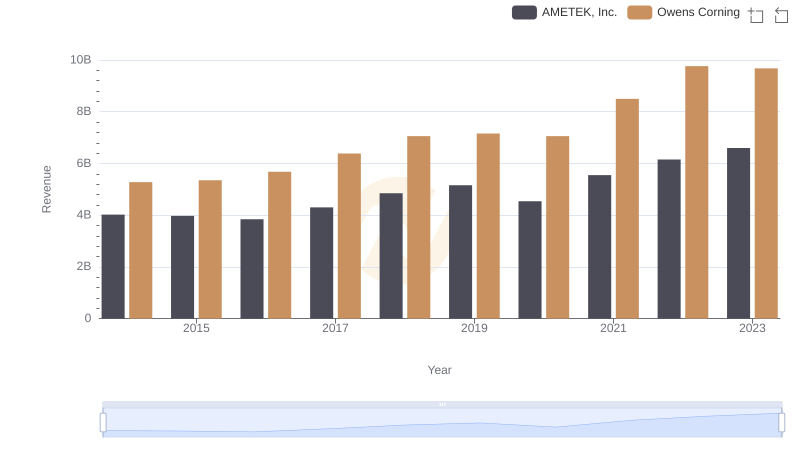
AMETEK, Inc. or Owens Corning: Who Leads in Yearly Revenue?
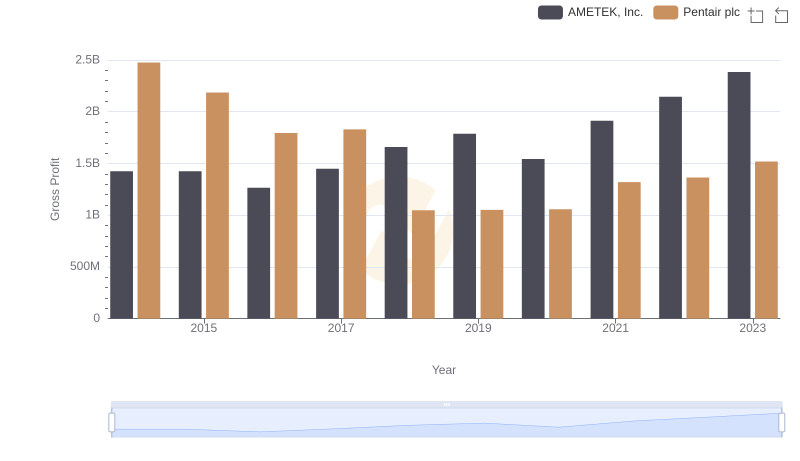
Gross Profit Analysis: Comparing AMETEK, Inc. and Pentair plc
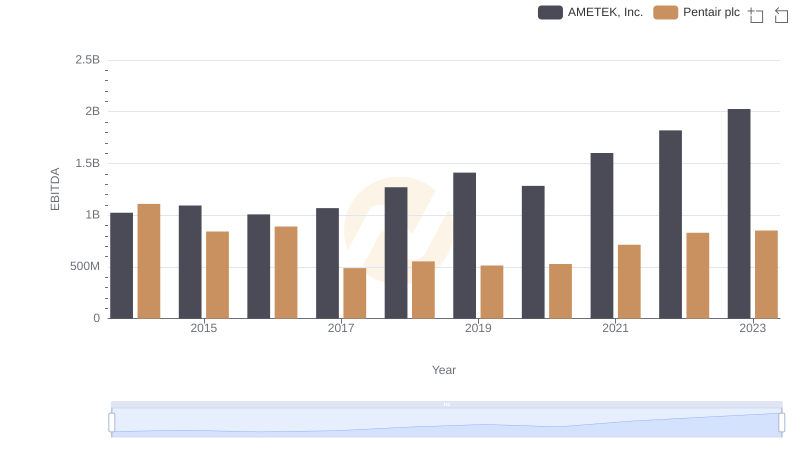
A Professional Review of EBITDA: AMETEK, Inc. Compared to Pentair plc