| __timestamp | AMETEK, Inc. | J.B. Hunt Transport Services, Inc. |
|---|---|---|
| Wednesday, January 1, 2014 | 462637000 | 152469000 |
| Thursday, January 1, 2015 | 448592000 | 166799000 |
| Friday, January 1, 2016 | 462970000 | 185436000 |
| Sunday, January 1, 2017 | 533645000 | 273440000 |
| Monday, January 1, 2018 | 584022000 | 323587000 |
| Tuesday, January 1, 2019 | 610280000 | 383981000 |
| Wednesday, January 1, 2020 | 515630000 | 348076000 |
| Friday, January 1, 2021 | 603944000 | 395533000 |
| Saturday, January 1, 2022 | 644577000 | 570191000 |
| Sunday, January 1, 2023 | 677006000 | 590242000 |
| Monday, January 1, 2024 | 696905000 |
Infusing magic into the data realm
In the ever-evolving landscape of corporate finance, understanding the nuances of Selling, General, and Administrative (SG&A) expenses is crucial. From 2014 to 2023, AMETEK, Inc. and J.B. Hunt Transport Services, Inc. have showcased distinct spending patterns. AMETEK's SG&A expenses have grown by approximately 46%, reflecting a strategic investment in operational efficiency and market expansion. In contrast, J.B. Hunt's SG&A expenses surged by nearly 287%, indicating a robust focus on scaling operations and enhancing service delivery.
These trends underscore the diverse strategies employed by these industry leaders to navigate the competitive landscape, offering valuable insights for investors and analysts alike.
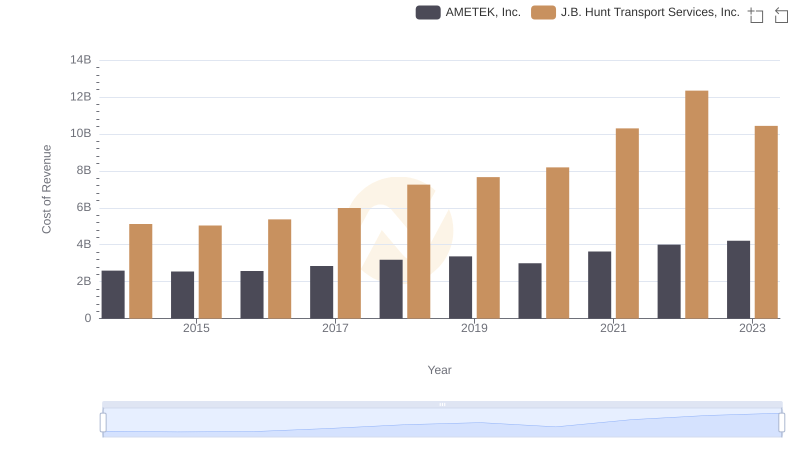
Cost of Revenue Trends: AMETEK, Inc. vs J.B. Hunt Transport Services, Inc.
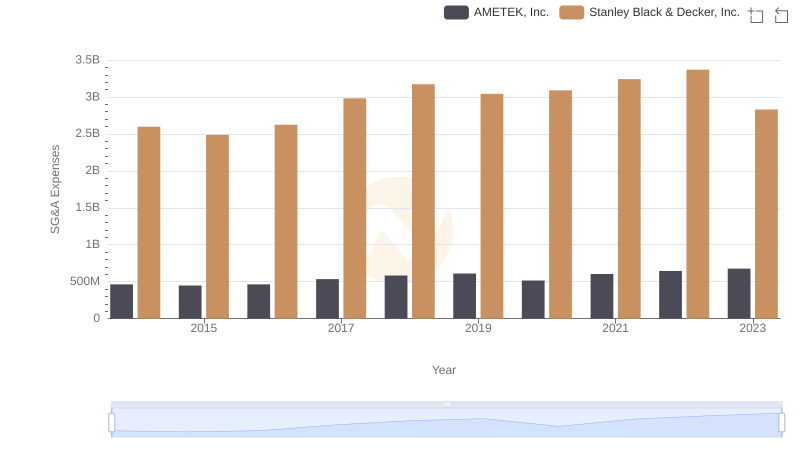
AMETEK, Inc. and Stanley Black & Decker, Inc.: SG&A Spending Patterns Compared

AMETEK, Inc. or TransUnion: Who Manages SG&A Costs Better?
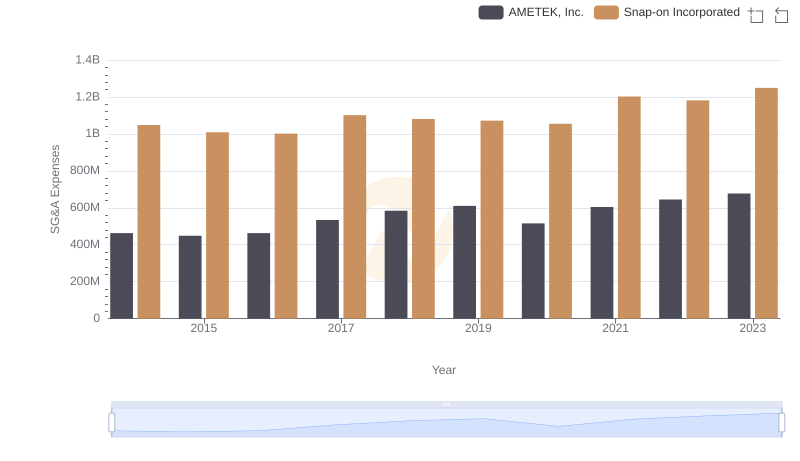
AMETEK, Inc. vs Snap-on Incorporated: SG&A Expense Trends
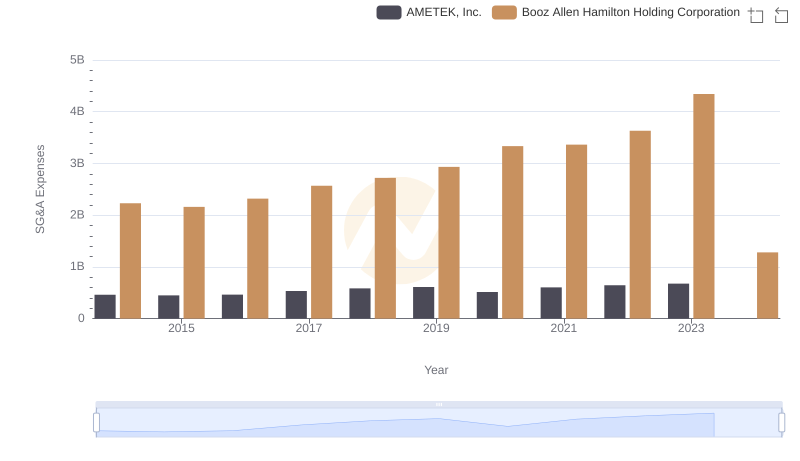
AMETEK, Inc. or Booz Allen Hamilton Holding Corporation: Who Manages SG&A Costs Better?
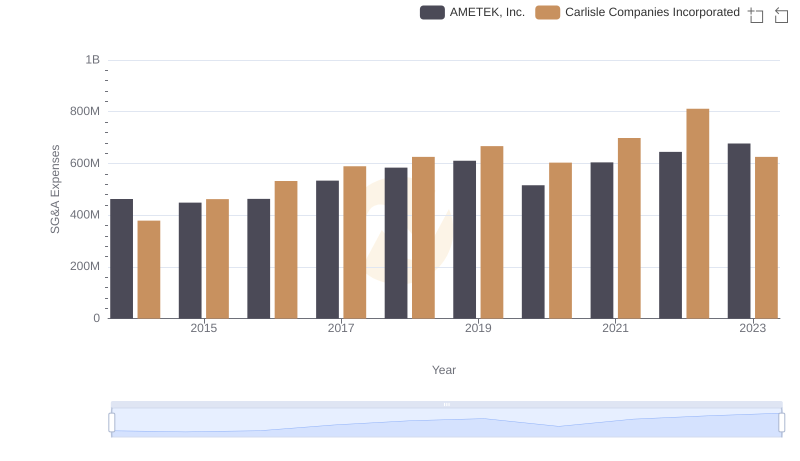
AMETEK, Inc. and Carlisle Companies Incorporated: SG&A Spending Patterns Compared
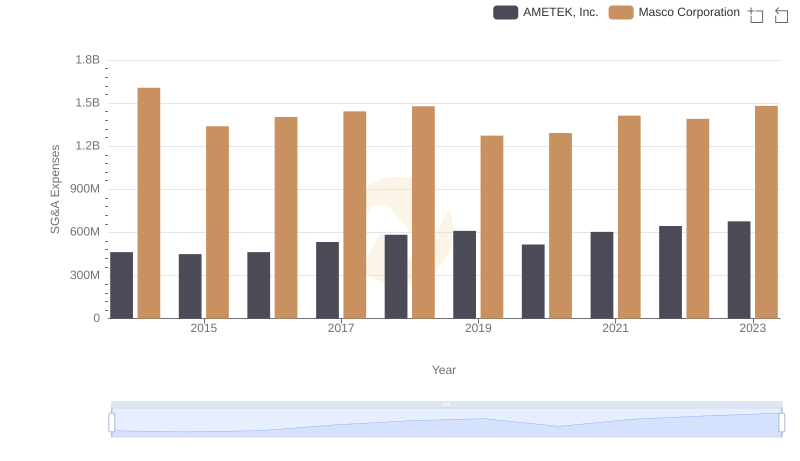
Cost Management Insights: SG&A Expenses for AMETEK, Inc. and Masco Corporation
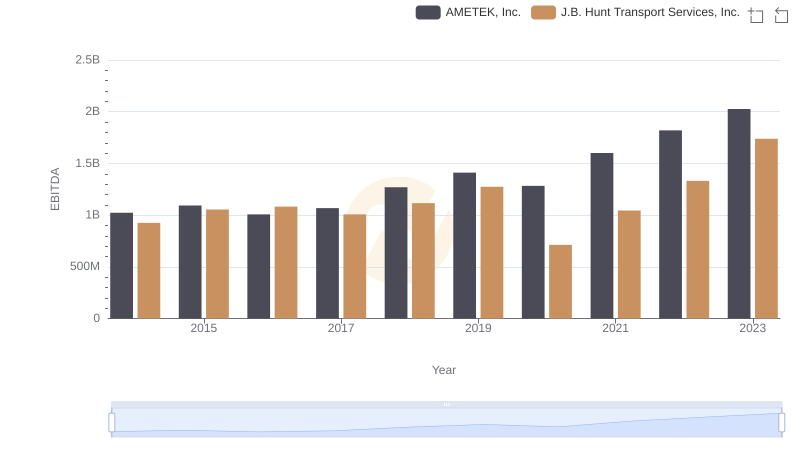
AMETEK, Inc. and J.B. Hunt Transport Services, Inc.: A Detailed Examination of EBITDA Performance
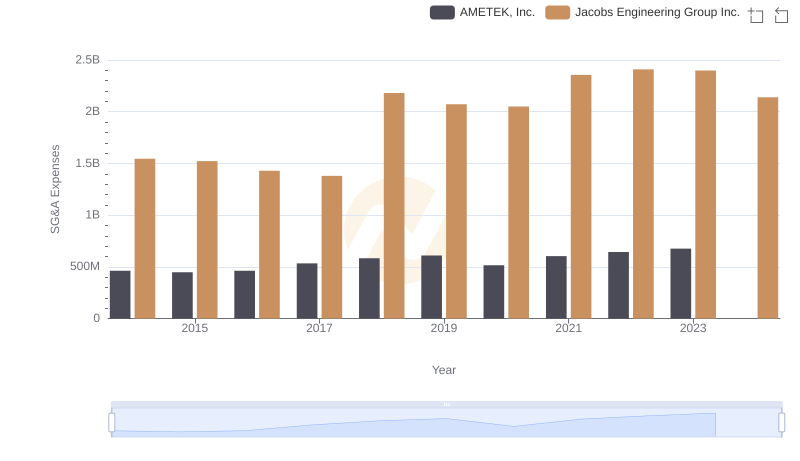
Who Optimizes SG&A Costs Better? AMETEK, Inc. or Jacobs Engineering Group Inc.