| __timestamp | AMETEK, Inc. | Textron Inc. |
|---|---|---|
| Wednesday, January 1, 2014 | 4021964000 | 13878000000 |
| Thursday, January 1, 2015 | 3974295000 | 13423000000 |
| Friday, January 1, 2016 | 3840087000 | 13788000000 |
| Sunday, January 1, 2017 | 4300170000 | 14198000000 |
| Monday, January 1, 2018 | 4845872000 | 13972000000 |
| Tuesday, January 1, 2019 | 5158557000 | 13630000000 |
| Wednesday, January 1, 2020 | 4540029000 | 11651000000 |
| Friday, January 1, 2021 | 5546514000 | 12382000000 |
| Saturday, January 1, 2022 | 6150530000 | 12869000000 |
| Sunday, January 1, 2023 | 6596950000 | 13683000000 |
| Monday, January 1, 2024 | 6941180000 | 13702000000 |
Data in motion
In the ever-evolving landscape of industrial manufacturing, AMETEK, Inc. and Textron Inc. have been pivotal players. Over the past decade, from 2014 to 2023, these companies have showcased distinct revenue trajectories. AMETEK, Inc. has seen a robust growth of approximately 64% in revenue, climbing from $4.02 billion in 2014 to $6.60 billion in 2023. This growth underscores AMETEK's strategic expansions and innovations in electronic instruments and electromechanical devices.
Conversely, Textron Inc., a leader in aerospace and defense, has experienced a more fluctuating revenue pattern. Despite a dip in 2020, likely due to global disruptions, Textron's revenue rebounded to $13.68 billion in 2023, marking a modest 1% increase from 2014. This resilience highlights Textron's adaptability in a competitive market. Notably, data for AMETEK in 2024 is missing, leaving room for speculation on its future trajectory.
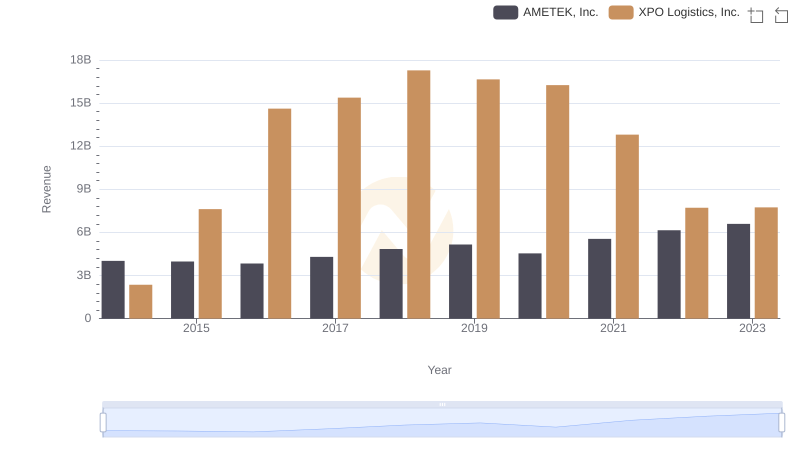
Who Generates More Revenue? AMETEK, Inc. or XPO Logistics, Inc.
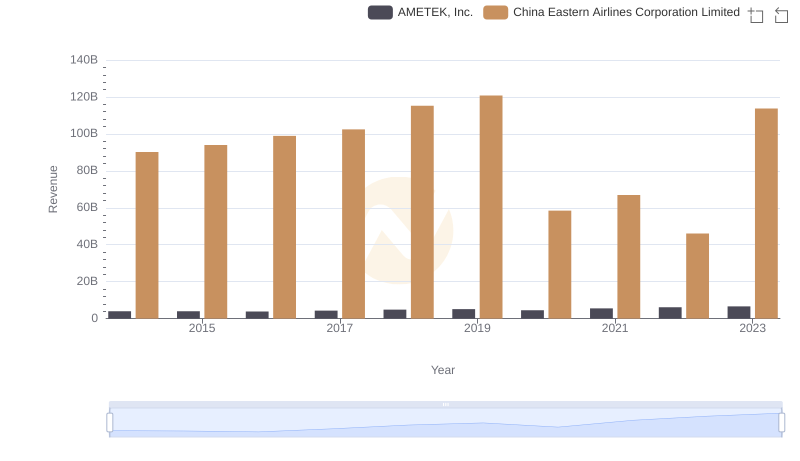
AMETEK, Inc. or China Eastern Airlines Corporation Limited: Who Leads in Yearly Revenue?
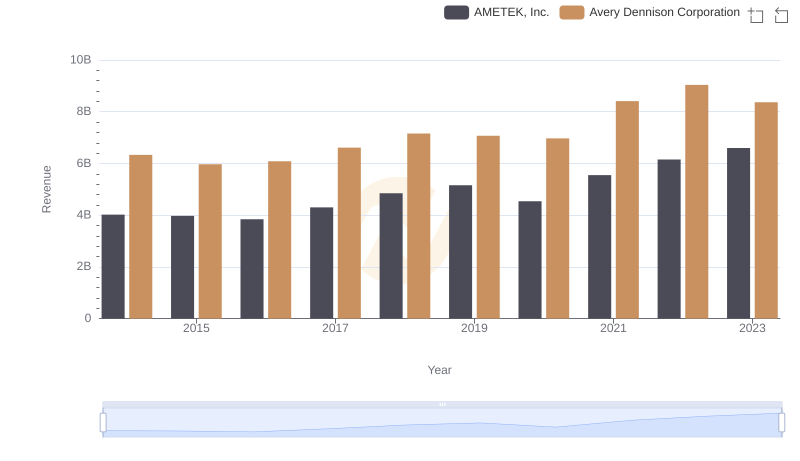
Breaking Down Revenue Trends: AMETEK, Inc. vs Avery Dennison Corporation
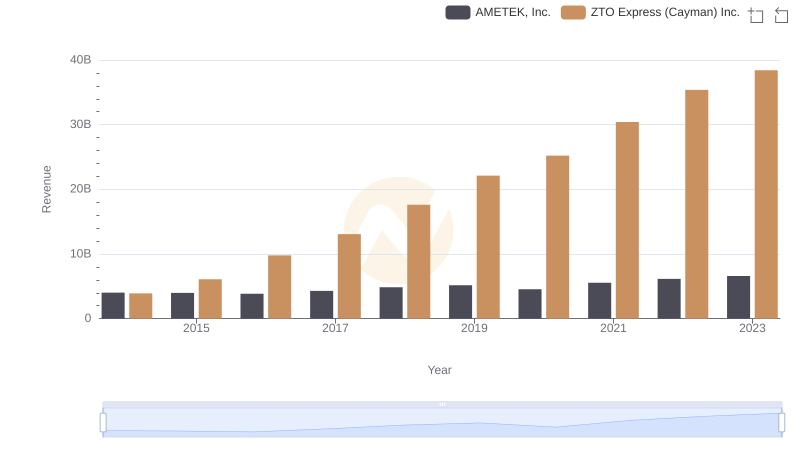
AMETEK, Inc. and ZTO Express (Cayman) Inc.: A Comprehensive Revenue Analysis
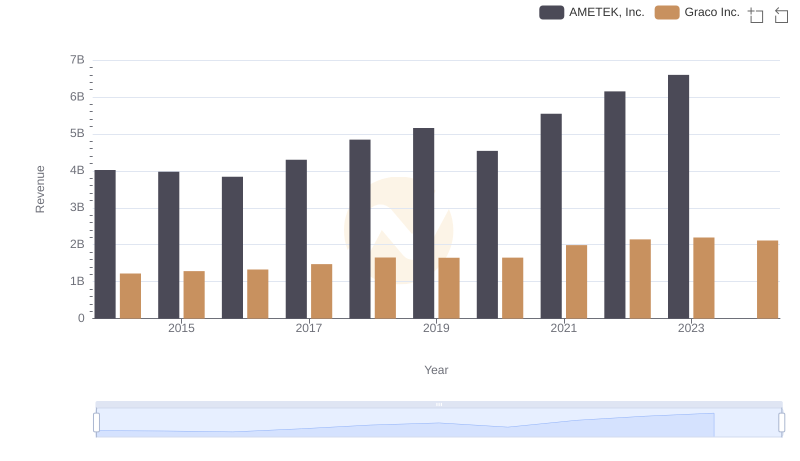
Annual Revenue Comparison: AMETEK, Inc. vs Graco Inc.
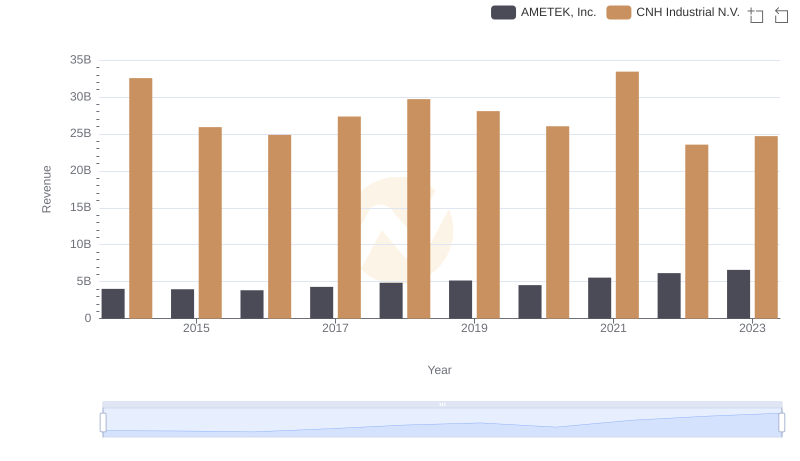
AMETEK, Inc. and CNH Industrial N.V.: A Comprehensive Revenue Analysis
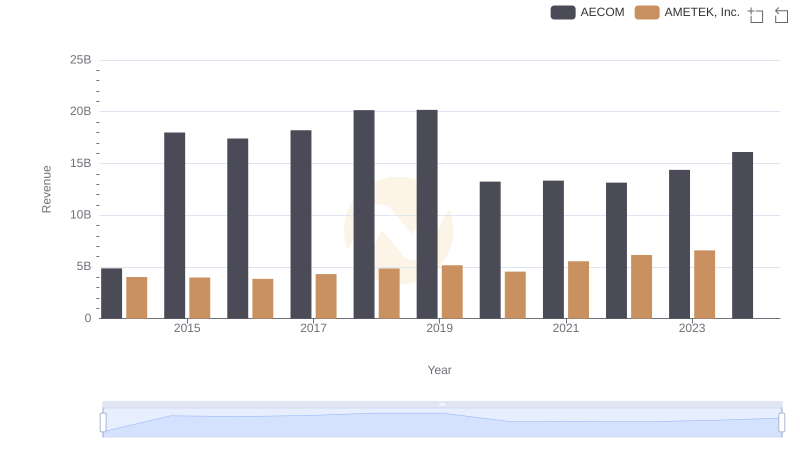
Who Generates More Revenue? AMETEK, Inc. or AECOM
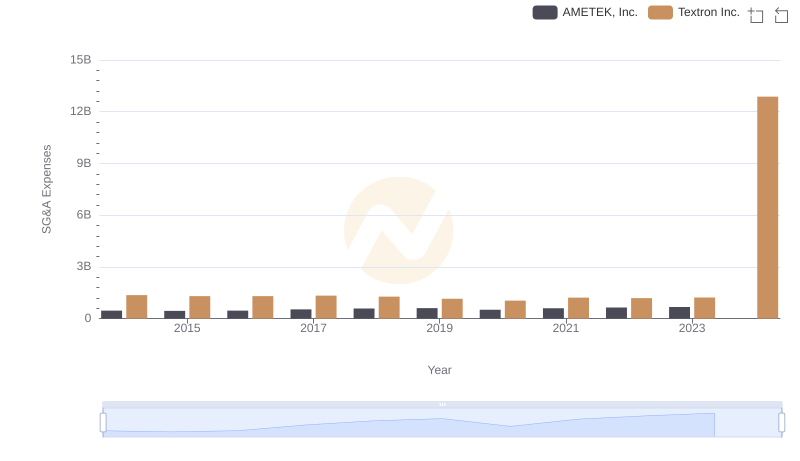
SG&A Efficiency Analysis: Comparing AMETEK, Inc. and Textron Inc.
A Professional Review of EBITDA: AMETEK, Inc. Compared to Textron Inc.