| __timestamp | Adobe Inc. | FLEETCOR Technologies, Inc. |
|---|---|---|
| Wednesday, January 1, 2014 | 3524985000 | 1026053000 |
| Thursday, January 1, 2015 | 4051194000 | 1371792000 |
| Friday, January 1, 2016 | 5034522000 | 1476132000 |
| Sunday, January 1, 2017 | 6291014000 | 1819925000 |
| Monday, January 1, 2018 | 7835009000 | 1945797000 |
| Tuesday, January 1, 2019 | 9498577000 | 2118179000 |
| Wednesday, January 1, 2020 | 11146000000 | 1792492000 |
| Friday, January 1, 2021 | 13920000000 | 2273917000 |
| Saturday, January 1, 2022 | 15441000000 | 2662422000 |
| Sunday, January 1, 2023 | 17055000000 | 2727580001 |
| Monday, January 1, 2024 | 19147000000 | 3974589000 |
Unleashing insights
In the ever-evolving landscape of technology and financial services, Adobe Inc. and FLEETCOR Technologies, Inc. have showcased intriguing gross profit trends over the past decade. Since 2014, Adobe has demonstrated a remarkable growth trajectory, with its gross profit surging by approximately 443% by 2023. This growth reflects Adobe's strategic innovations and market expansion, particularly in digital media and marketing solutions.
Conversely, FLEETCOR Technologies, a leader in specialized payment products, has experienced a steady yet modest increase in gross profit, growing by about 166% over the same period. This growth underscores FLEETCOR's resilience and adaptability in the financial services sector.
While Adobe's gross profit reached an impressive $19.1 billion in 2024, FLEETCOR's data for the same year remains unavailable, highlighting potential data gaps. These trends offer valuable insights into the financial health and strategic directions of these industry giants.
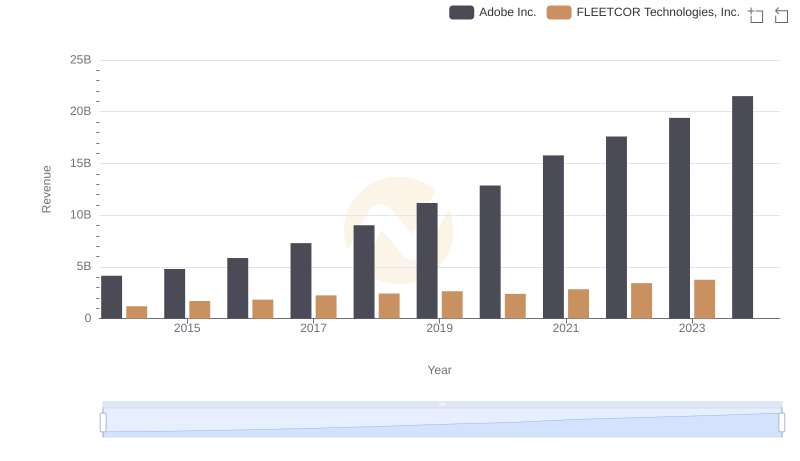
Revenue Showdown: Adobe Inc. vs FLEETCOR Technologies, Inc.
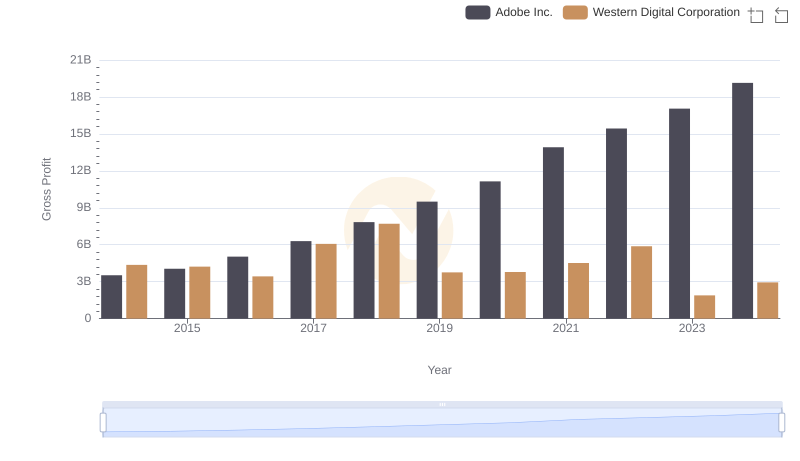
Gross Profit Trends Compared: Adobe Inc. vs Western Digital Corporation
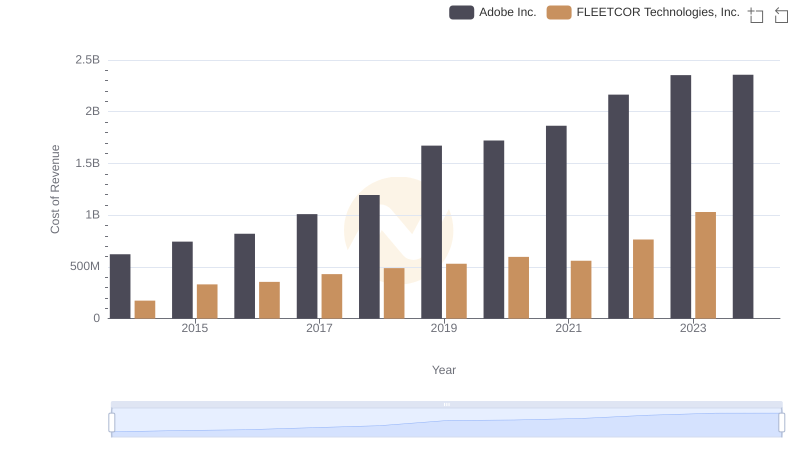
Adobe Inc. vs FLEETCOR Technologies, Inc.: Efficiency in Cost of Revenue Explored
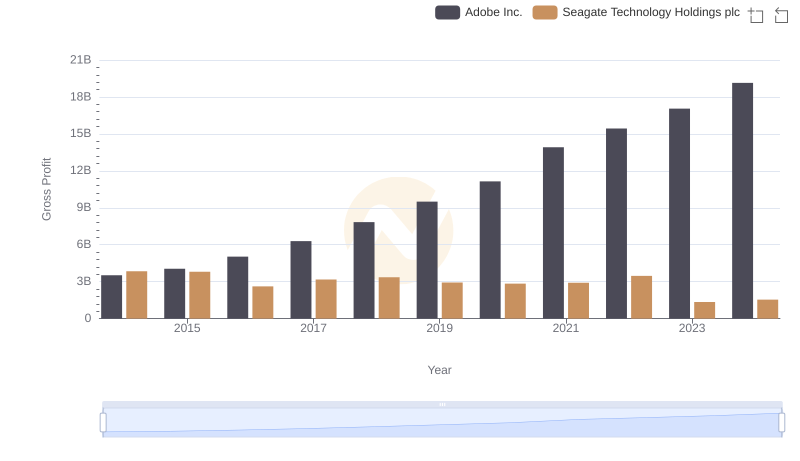
Gross Profit Comparison: Adobe Inc. and Seagate Technology Holdings plc Trends
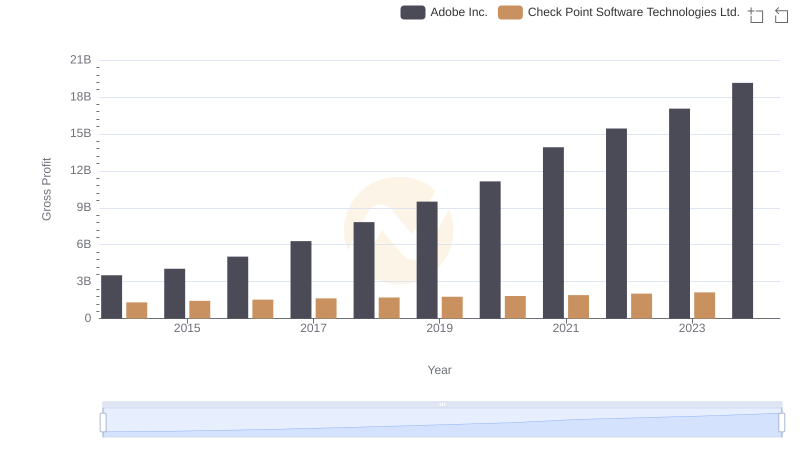
Adobe Inc. vs Check Point Software Technologies Ltd.: A Gross Profit Performance Breakdown
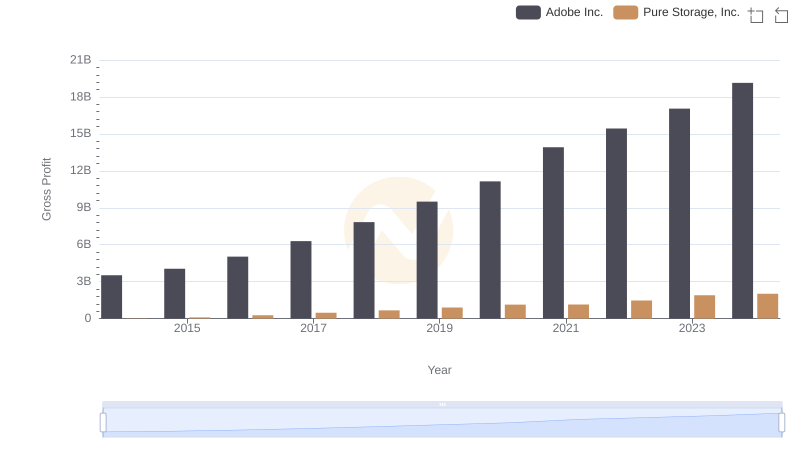
Gross Profit Comparison: Adobe Inc. and Pure Storage, Inc. Trends
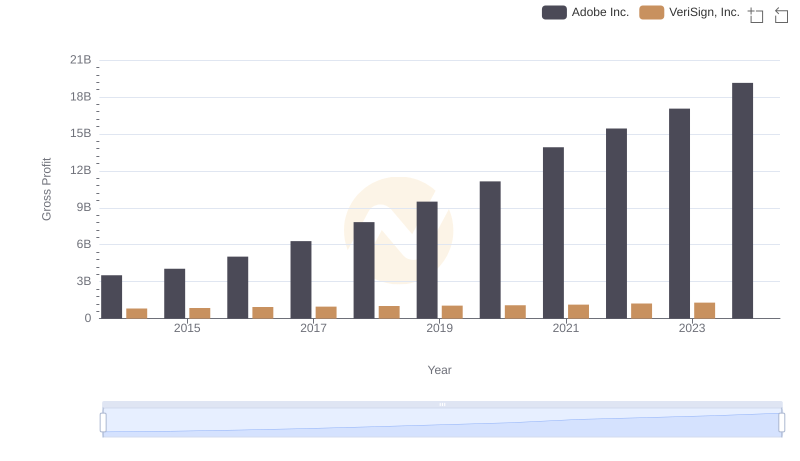
Gross Profit Trends Compared: Adobe Inc. vs VeriSign, Inc.
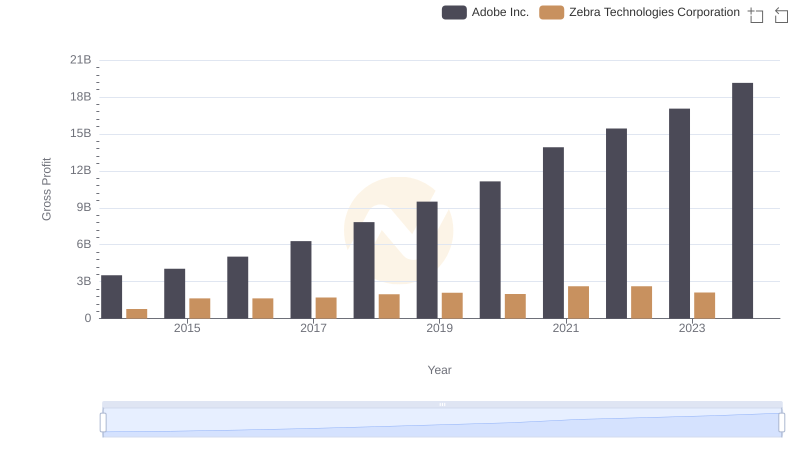
Gross Profit Analysis: Comparing Adobe Inc. and Zebra Technologies Corporation
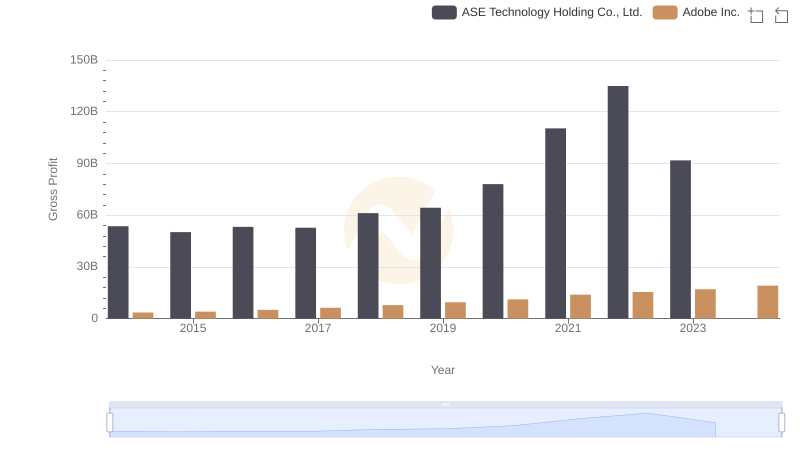
Adobe Inc. vs ASE Technology Holding Co., Ltd.: A Gross Profit Performance Breakdown
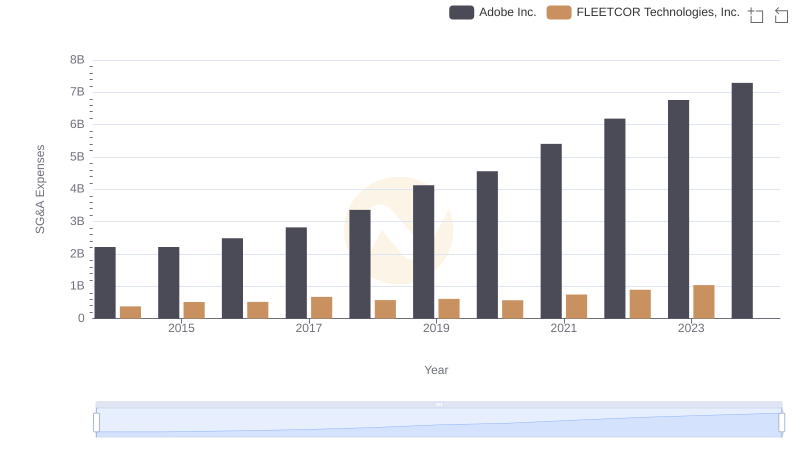
Adobe Inc. or FLEETCOR Technologies, Inc.: Who Manages SG&A Costs Better?

Key Insights on Gross Profit: Adobe Inc. vs SS&C Technologies Holdings, Inc.
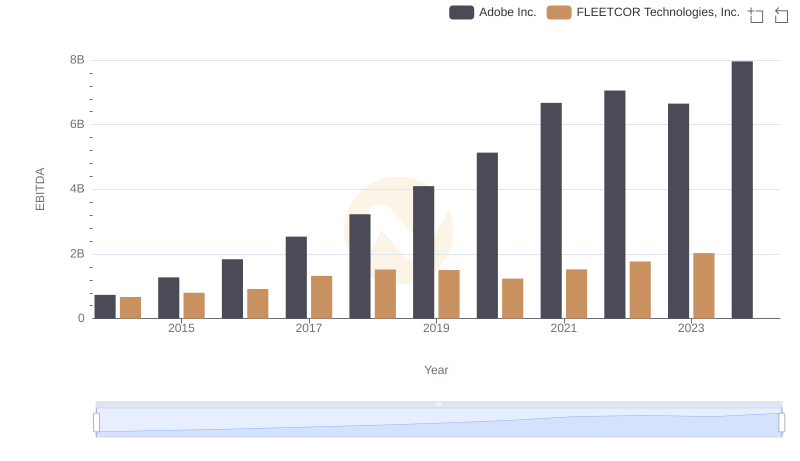
EBITDA Analysis: Evaluating Adobe Inc. Against FLEETCOR Technologies, Inc.