| __timestamp | Owens Corning | Waste Management, Inc. |
|---|---|---|
| Wednesday, January 1, 2014 | 976000000 | 4994000000 |
| Thursday, January 1, 2015 | 1153000000 | 4730000000 |
| Friday, January 1, 2016 | 1381000000 | 5123000000 |
| Sunday, January 1, 2017 | 1572000000 | 5464000000 |
| Monday, January 1, 2018 | 1632000000 | 5665000000 |
| Tuesday, January 1, 2019 | 1609000000 | 5959000000 |
| Wednesday, January 1, 2020 | 1610000000 | 5877000000 |
| Friday, January 1, 2021 | 2217000000 | 6820000000 |
| Saturday, January 1, 2022 | 2616000000 | 7404000000 |
| Sunday, January 1, 2023 | 2683000000 | 7820000000 |
| Monday, January 1, 2024 | 8680000000 |
Unlocking the unknown
In the ever-evolving landscape of American industry, Waste Management, Inc. and Owens Corning have emerged as key players, each carving out a significant niche. Over the past decade, from 2014 to 2023, these companies have demonstrated remarkable growth in gross profit, reflecting their strategic prowess and market adaptability.
Waste Management, Inc. has consistently outperformed, with a gross profit increase of approximately 57% over this period. By 2023, their gross profit reached a staggering $7.82 billion, underscoring their dominance in the waste management sector. Meanwhile, Owens Corning, a leader in building materials, saw its gross profit grow by about 175%, reaching $2.68 billion in 2023. This impressive growth trajectory highlights their innovative approach and resilience in a competitive market.
These insights not only showcase financial success but also reflect broader economic trends and consumer demands in the United States.
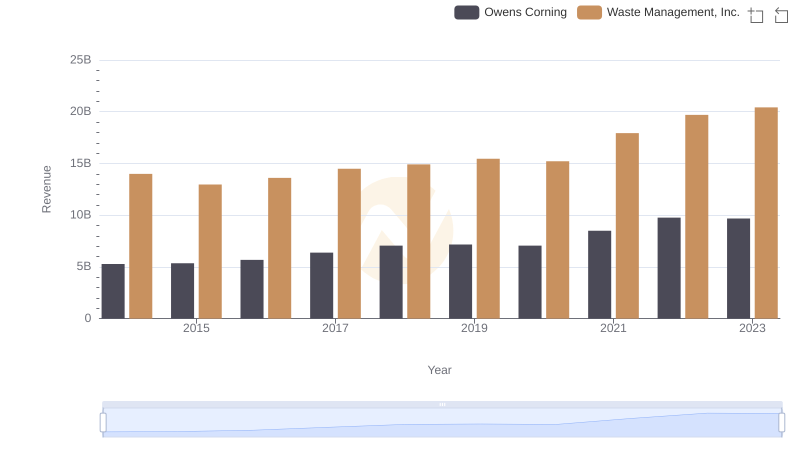
Revenue Insights: Waste Management, Inc. and Owens Corning Performance Compared
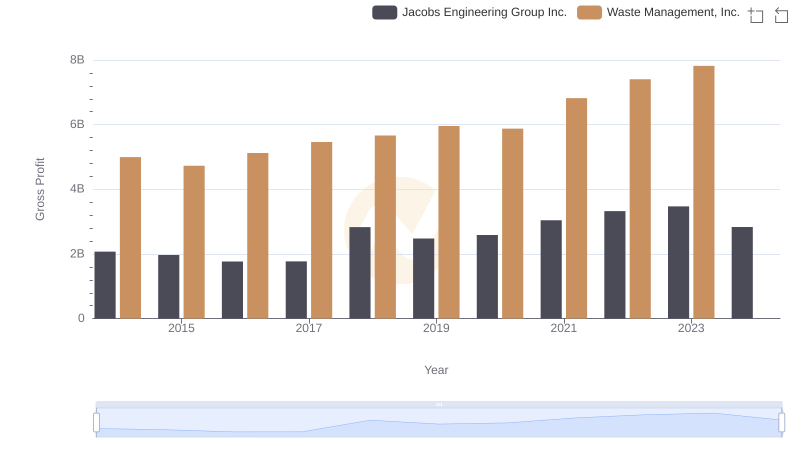
Waste Management, Inc. and Jacobs Engineering Group Inc.: A Detailed Gross Profit Analysis
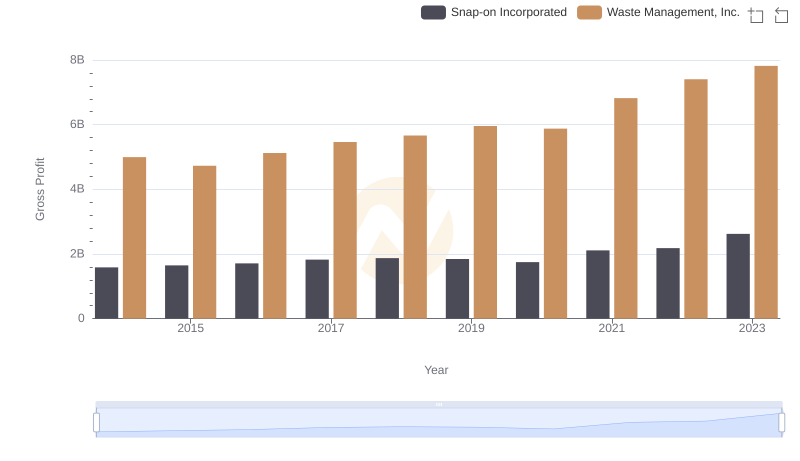
Waste Management, Inc. and Snap-on Incorporated: A Detailed Gross Profit Analysis
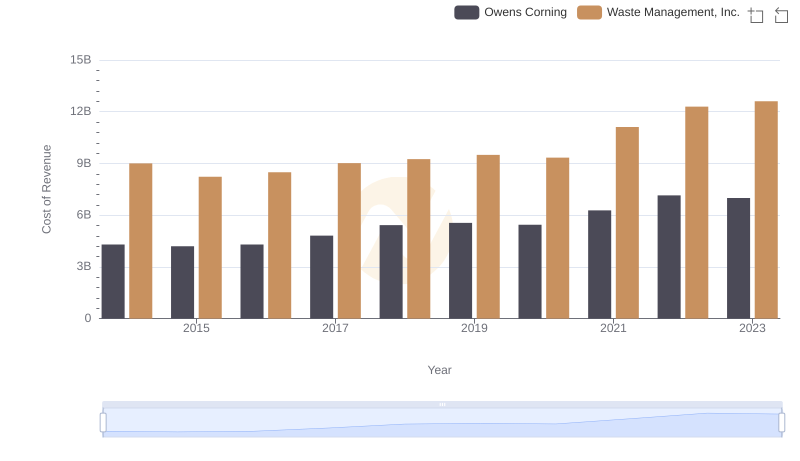
Comparing Cost of Revenue Efficiency: Waste Management, Inc. vs Owens Corning
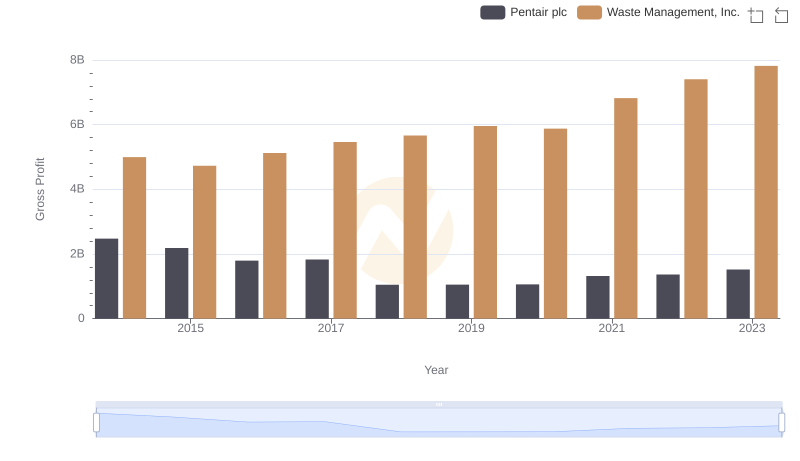
Who Generates Higher Gross Profit? Waste Management, Inc. or Pentair plc
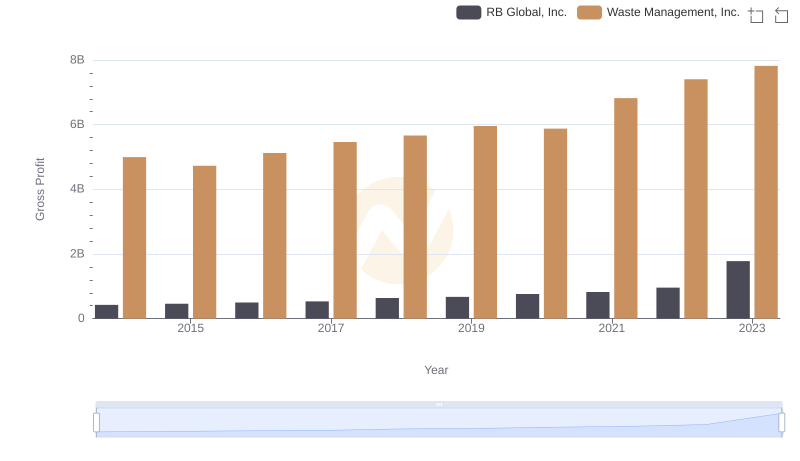
Gross Profit Comparison: Waste Management, Inc. and RB Global, Inc. Trends
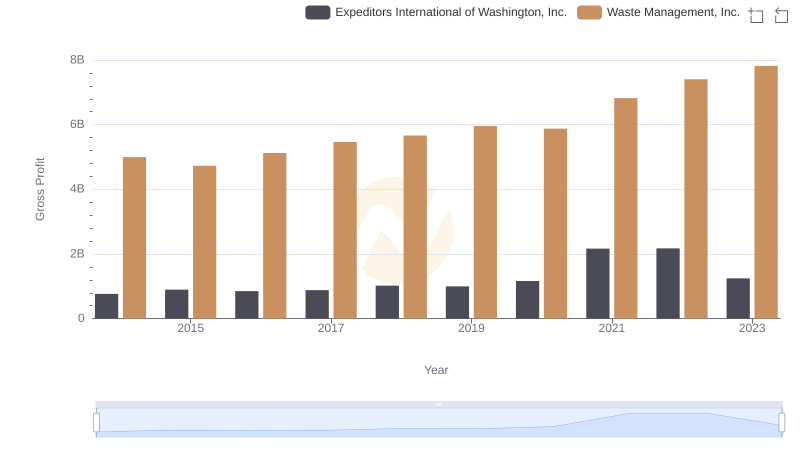
Who Generates Higher Gross Profit? Waste Management, Inc. or Expeditors International of Washington, Inc.
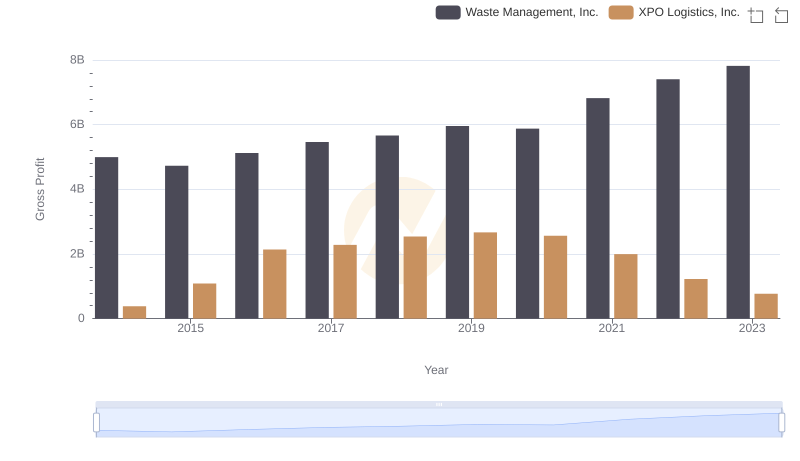
Gross Profit Analysis: Comparing Waste Management, Inc. and XPO Logistics, Inc.
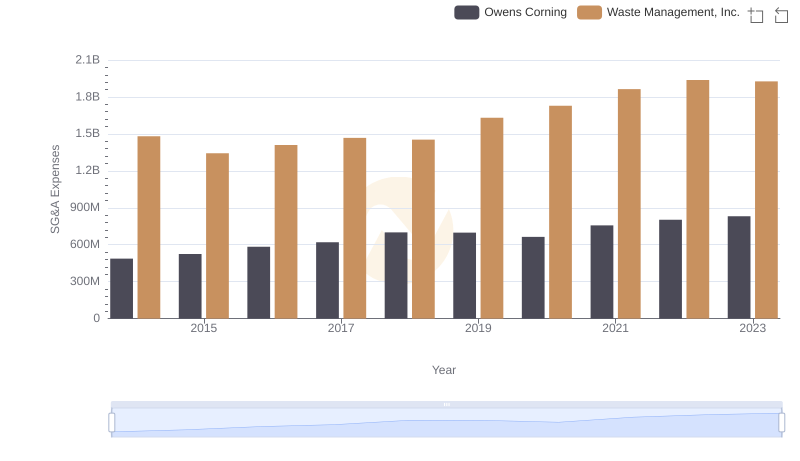
Selling, General, and Administrative Costs: Waste Management, Inc. vs Owens Corning
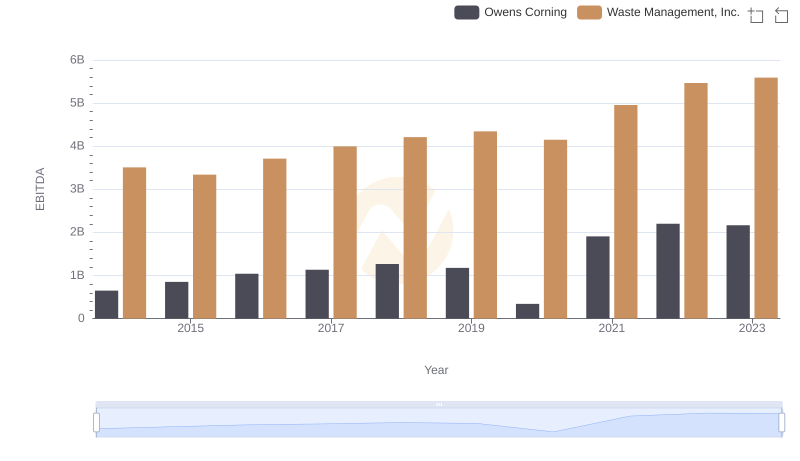
A Side-by-Side Analysis of EBITDA: Waste Management, Inc. and Owens Corning