| __timestamp | J.B. Hunt Transport Services, Inc. | Rockwell Automation, Inc. |
|---|---|---|
| Wednesday, January 1, 2014 | 926038000 | 1346000000 |
| Thursday, January 1, 2015 | 1055307000 | 1359100000 |
| Friday, January 1, 2016 | 1082601000 | 1200700000 |
| Sunday, January 1, 2017 | 1007307000 | 1258400000 |
| Monday, January 1, 2018 | 1116914000 | 1568400000 |
| Tuesday, January 1, 2019 | 1274241000 | 1150200000 |
| Wednesday, January 1, 2020 | 713119000 | 1410200000 |
| Friday, January 1, 2021 | 1045530000 | 1808300000 |
| Saturday, January 1, 2022 | 1331553000 | 1432100000 |
| Sunday, January 1, 2023 | 1738774000 | 1990700000 |
| Monday, January 1, 2024 | 1567500000 |
Unleashing the power of data
In the ever-evolving landscape of American industry, Rockwell Automation and J.B. Hunt Transport Services stand as titans in their respective fields. From 2014 to 2023, these companies have demonstrated remarkable EBITDA growth, a key indicator of financial health and operational efficiency. Rockwell Automation, a leader in industrial automation, saw its EBITDA rise by approximately 48% over this period, peaking in 2023. Meanwhile, J.B. Hunt, a major player in transportation and logistics, experienced a staggering 88% increase, highlighting its robust adaptability and market expansion.
The data for 2024 is incomplete, suggesting a need for cautious optimism as these industry giants continue to navigate economic challenges.
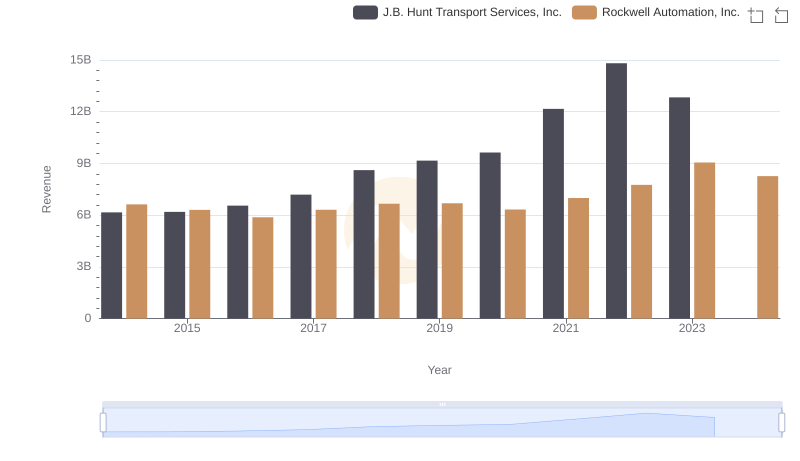
Rockwell Automation, Inc. vs J.B. Hunt Transport Services, Inc.: Annual Revenue Growth Compared
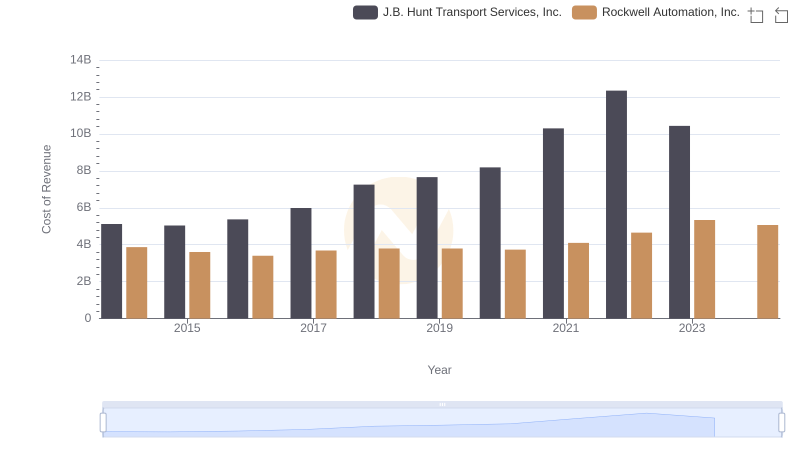
Analyzing Cost of Revenue: Rockwell Automation, Inc. and J.B. Hunt Transport Services, Inc.
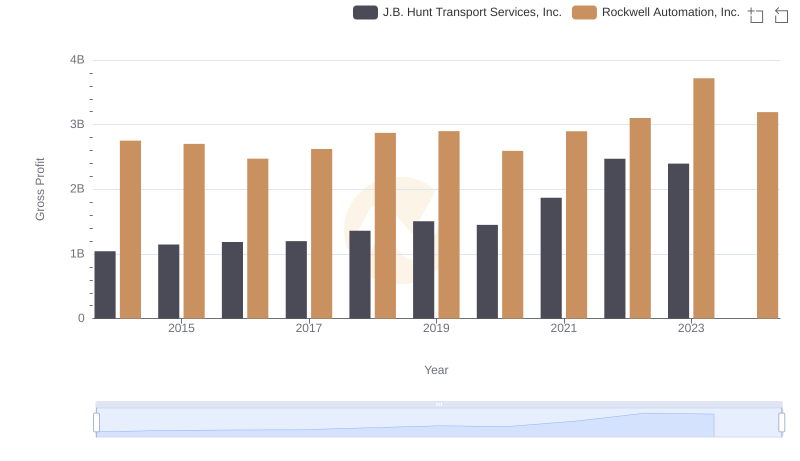
Key Insights on Gross Profit: Rockwell Automation, Inc. vs J.B. Hunt Transport Services, Inc.
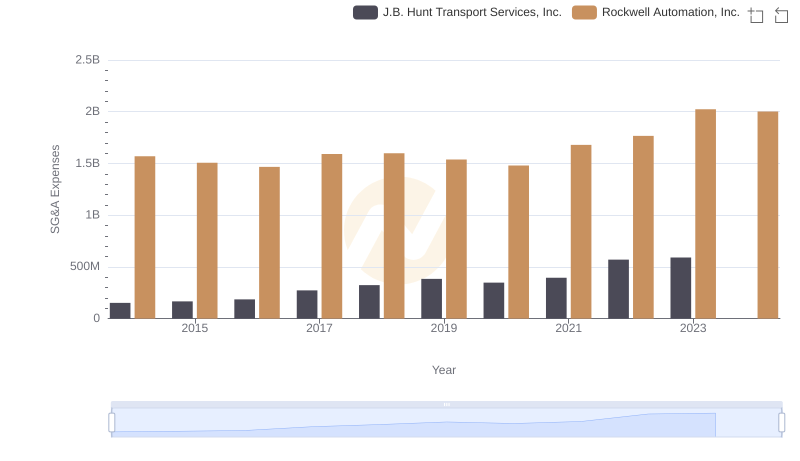
Breaking Down SG&A Expenses: Rockwell Automation, Inc. vs J.B. Hunt Transport Services, Inc.

A Side-by-Side Analysis of EBITDA: Rockwell Automation, Inc. and Carlisle Companies Incorporated
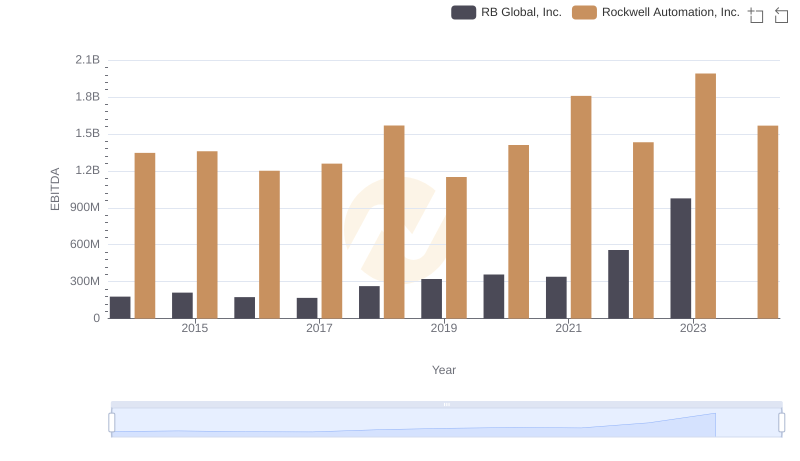
Rockwell Automation, Inc. and RB Global, Inc.: A Detailed Examination of EBITDA Performance
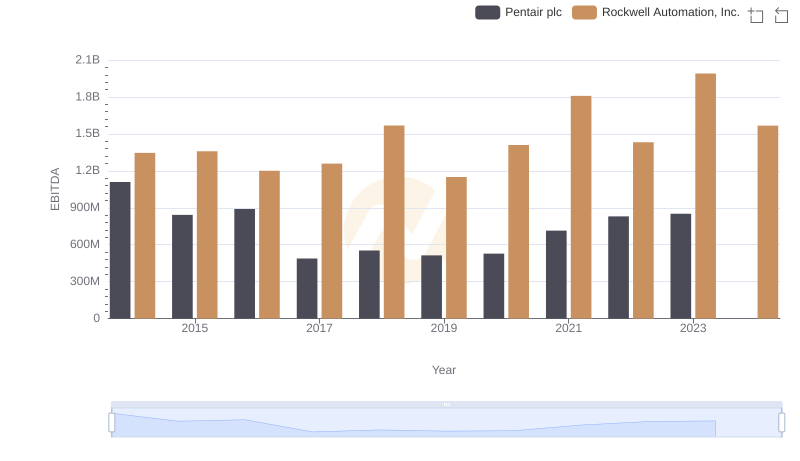
Comprehensive EBITDA Comparison: Rockwell Automation, Inc. vs Pentair plc
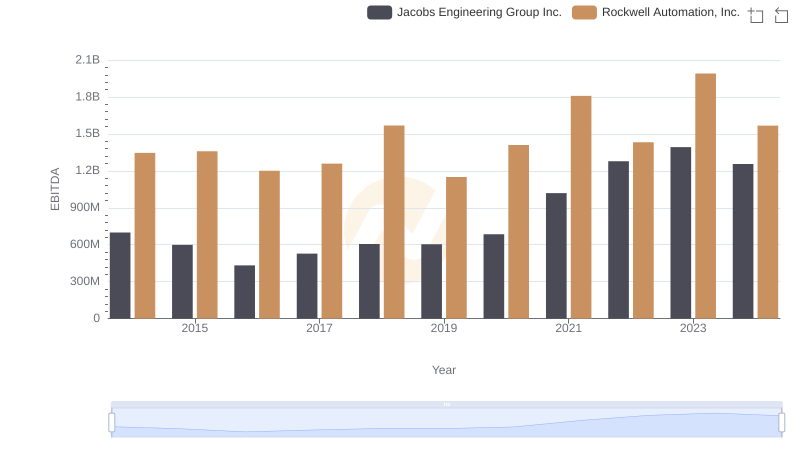
Rockwell Automation, Inc. vs Jacobs Engineering Group Inc.: In-Depth EBITDA Performance Comparison

Comprehensive EBITDA Comparison: Rockwell Automation, Inc. vs XPO Logistics, Inc.

A Professional Review of EBITDA: Rockwell Automation, Inc. Compared to Expeditors International of Washington, Inc.
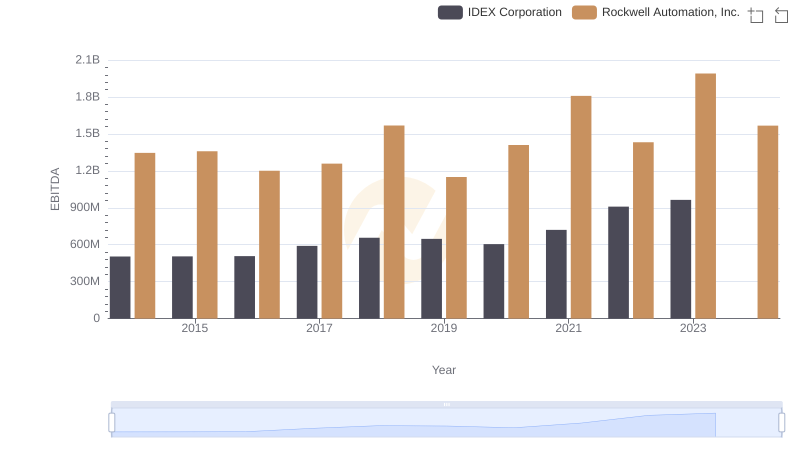
Rockwell Automation, Inc. vs IDEX Corporation: In-Depth EBITDA Performance Comparison