| __timestamp | Masco Corporation | Rockwell Automation, Inc. |
|---|---|---|
| Wednesday, January 1, 2014 | 899000000 | 1346000000 |
| Thursday, January 1, 2015 | 1041000000 | 1359100000 |
| Friday, January 1, 2016 | 1220000000 | 1200700000 |
| Sunday, January 1, 2017 | 1314000000 | 1258400000 |
| Monday, January 1, 2018 | 1240000000 | 1568400000 |
| Tuesday, January 1, 2019 | 1244000000 | 1150200000 |
| Wednesday, January 1, 2020 | 1410000000 | 1410200000 |
| Friday, January 1, 2021 | 1185000000 | 1808300000 |
| Saturday, January 1, 2022 | 1490000000 | 1432100000 |
| Sunday, January 1, 2023 | 1493000000 | 1990700000 |
| Monday, January 1, 2024 | 1410000000 | 1567500000 |
Unveiling the hidden dimensions of data
In the ever-evolving landscape of industrial automation and home improvement, Rockwell Automation, Inc. and Masco Corporation stand as titans. Over the past decade, Rockwell Automation has consistently outperformed Masco in terms of EBITDA, showcasing a robust growth trajectory. From 2014 to 2023, Rockwell's EBITDA surged by approximately 48%, peaking in 2023, while Masco's EBITDA grew by about 66% over the same period. Notably, Rockwell's EBITDA reached its zenith in 2023, marking a significant milestone. However, the data for 2024 reveals a gap for Masco, indicating potential challenges or strategic shifts. This comparative analysis not only highlights the financial prowess of these corporations but also underscores the dynamic nature of their respective industries. As we look to the future, the question remains: will Masco close the gap, or will Rockwell continue to lead the charge?

Who Generates More Revenue? Rockwell Automation, Inc. or Masco Corporation
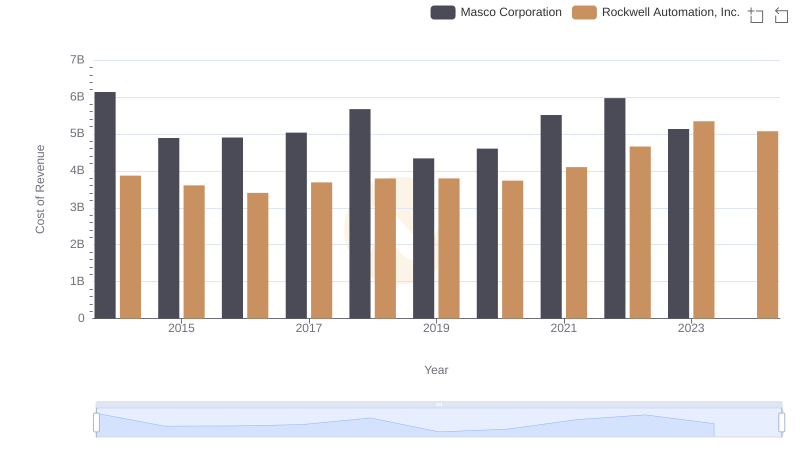
Analyzing Cost of Revenue: Rockwell Automation, Inc. and Masco Corporation
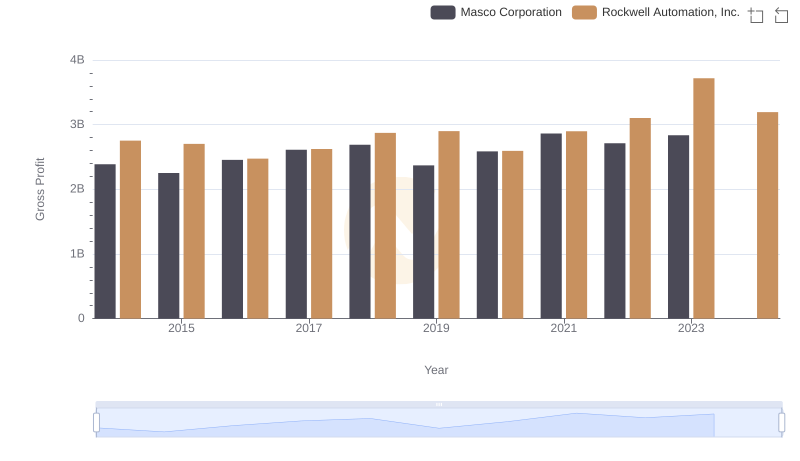
Gross Profit Trends Compared: Rockwell Automation, Inc. vs Masco Corporation
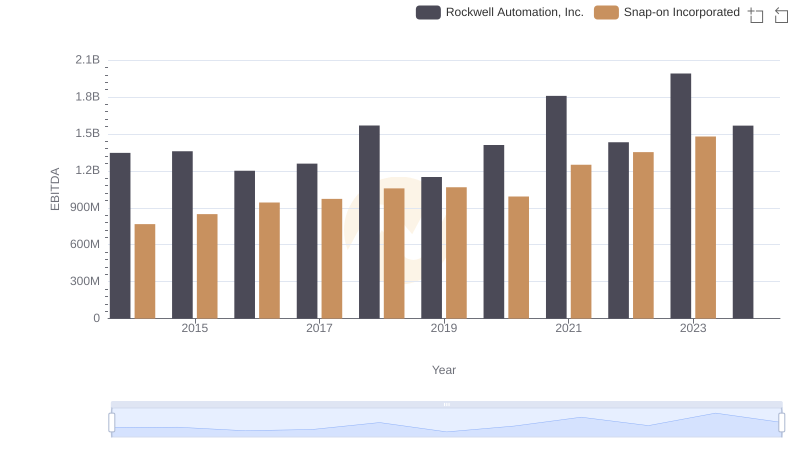
EBITDA Metrics Evaluated: Rockwell Automation, Inc. vs Snap-on Incorporated
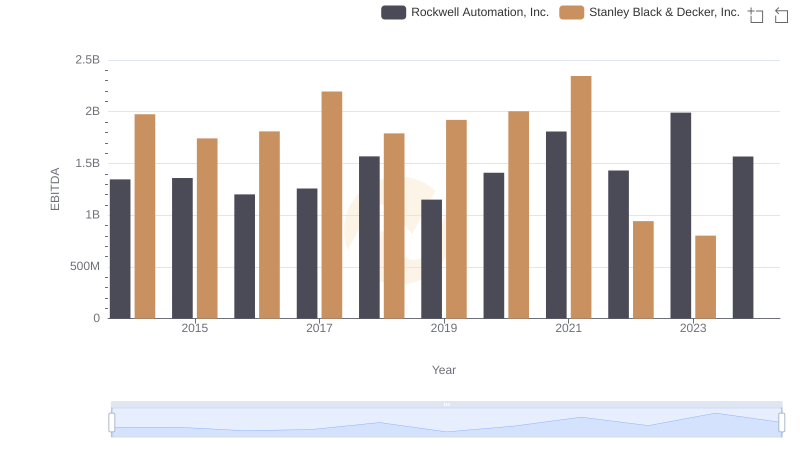
Rockwell Automation, Inc. and Stanley Black & Decker, Inc.: A Detailed Examination of EBITDA Performance

A Side-by-Side Analysis of EBITDA: Rockwell Automation, Inc. and Carlisle Companies Incorporated
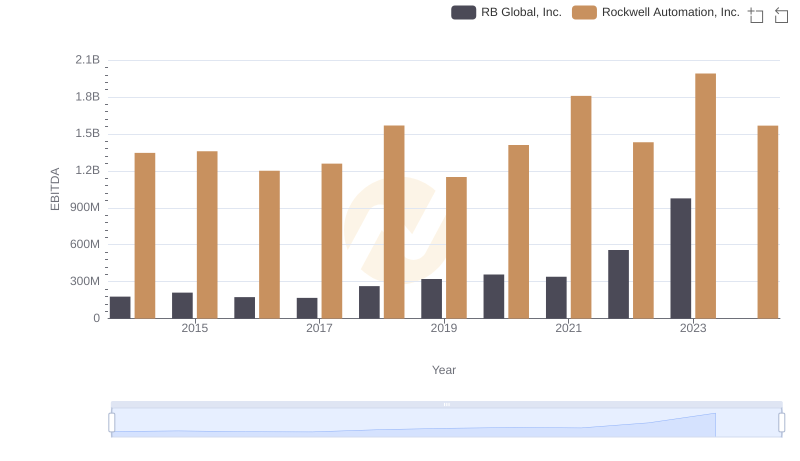
Rockwell Automation, Inc. and RB Global, Inc.: A Detailed Examination of EBITDA Performance
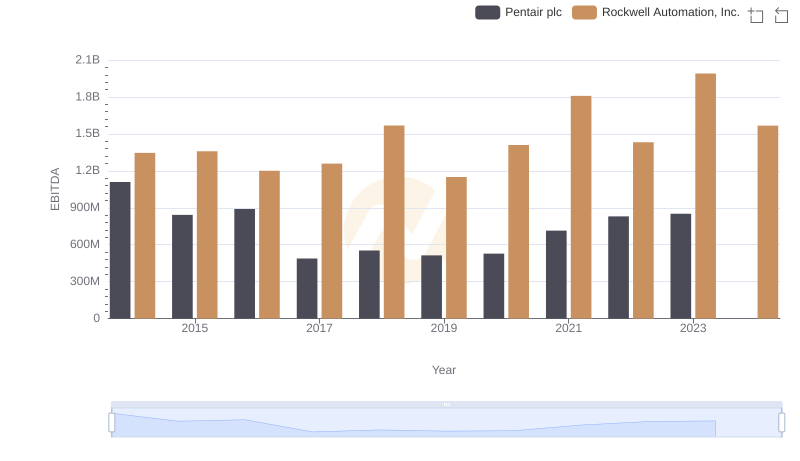
Comprehensive EBITDA Comparison: Rockwell Automation, Inc. vs Pentair plc
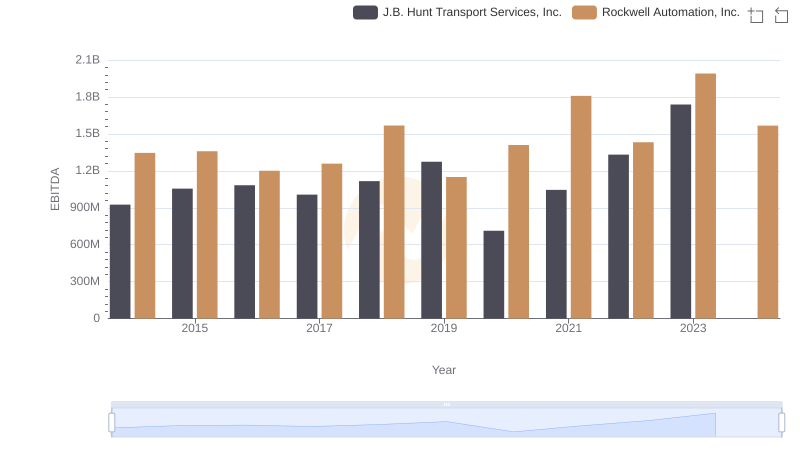
Rockwell Automation, Inc. and J.B. Hunt Transport Services, Inc.: A Detailed Examination of EBITDA Performance
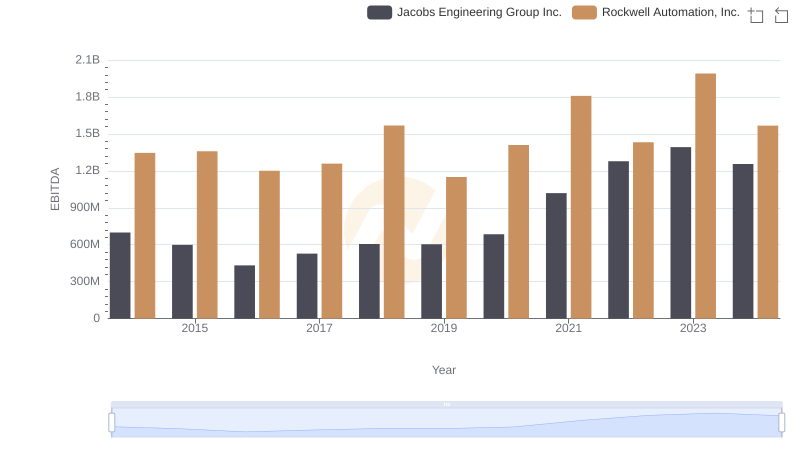
Rockwell Automation, Inc. vs Jacobs Engineering Group Inc.: In-Depth EBITDA Performance Comparison