| __timestamp | Rockwell Automation, Inc. | Stanley Black & Decker, Inc. |
|---|---|---|
| Wednesday, January 1, 2014 | 1346000000 | 1975400000 |
| Thursday, January 1, 2015 | 1359100000 | 1741900000 |
| Friday, January 1, 2016 | 1200700000 | 1810200000 |
| Sunday, January 1, 2017 | 1258400000 | 2196000000 |
| Monday, January 1, 2018 | 1568400000 | 1791200000 |
| Tuesday, January 1, 2019 | 1150200000 | 1920600000 |
| Wednesday, January 1, 2020 | 1410200000 | 2004200000 |
| Friday, January 1, 2021 | 1808300000 | 2345500000 |
| Saturday, January 1, 2022 | 1432100000 | 942800000 |
| Sunday, January 1, 2023 | 1990700000 | 802700000 |
| Monday, January 1, 2024 | 1567500000 | 286300000 |
Cracking the code
Since 2014, Rockwell Automation, Inc. and Stanley Black & Decker, Inc. have been pivotal players in the industrial sector. Their EBITDA performance over the years offers a fascinating glimpse into their financial health and strategic maneuvers.
From 2014 to 2023, Rockwell Automation's EBITDA grew by approximately 48%, peaking in 2023. This growth reflects their robust operational strategies and market adaptability. In contrast, Stanley Black & Decker experienced a 59% decline in EBITDA from 2021 to 2023, indicating potential challenges or strategic shifts.
The absence of Stanley Black & Decker's 2024 data suggests a need for further investigation into their recent financial activities.
This analysis underscores the dynamic nature of the industrial sector, where strategic decisions significantly impact financial outcomes. Stay tuned for more insights as we continue to track these industry giants.
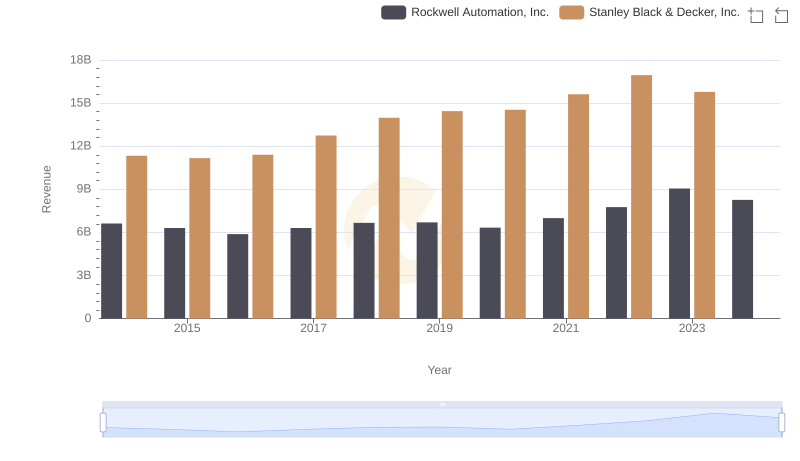
Who Generates More Revenue? Rockwell Automation, Inc. or Stanley Black & Decker, Inc.

Comparing Cost of Revenue Efficiency: Rockwell Automation, Inc. vs Stanley Black & Decker, Inc.

Who Generates Higher Gross Profit? Rockwell Automation, Inc. or Stanley Black & Decker, Inc.
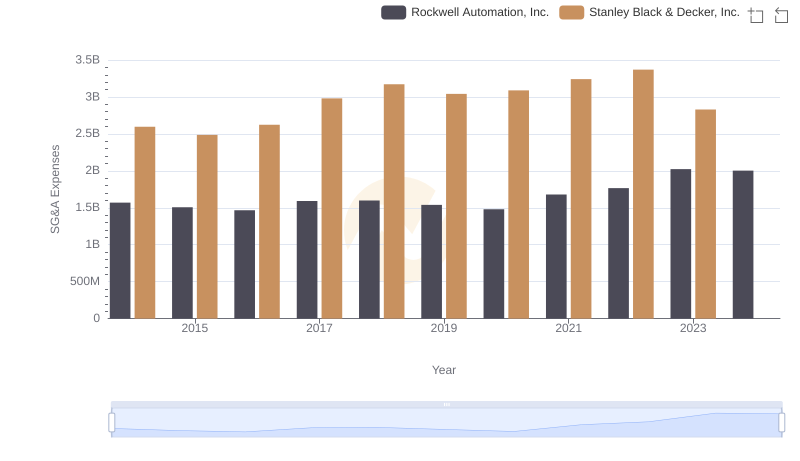
Selling, General, and Administrative Costs: Rockwell Automation, Inc. vs Stanley Black & Decker, Inc.
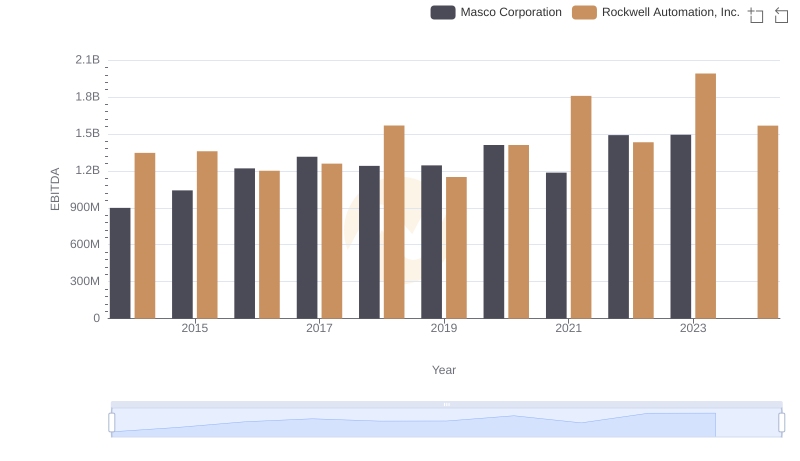
Professional EBITDA Benchmarking: Rockwell Automation, Inc. vs Masco Corporation
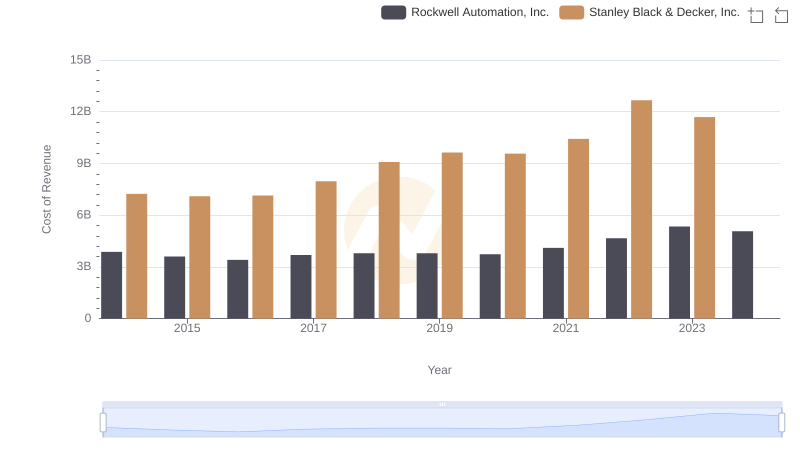
Rockwell Automation, Inc. vs Stanley Black & Decker, Inc.: Efficiency in Cost of Revenue Explored
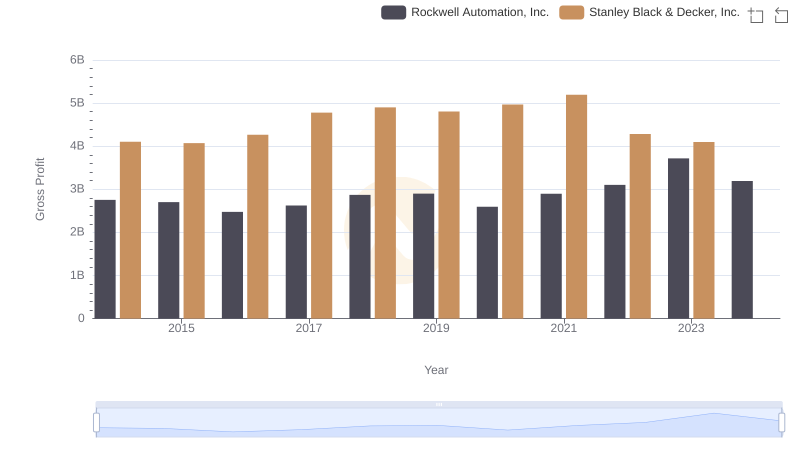
Who Generates Higher Gross Profit? Rockwell Automation, Inc. or Stanley Black & Decker, Inc.
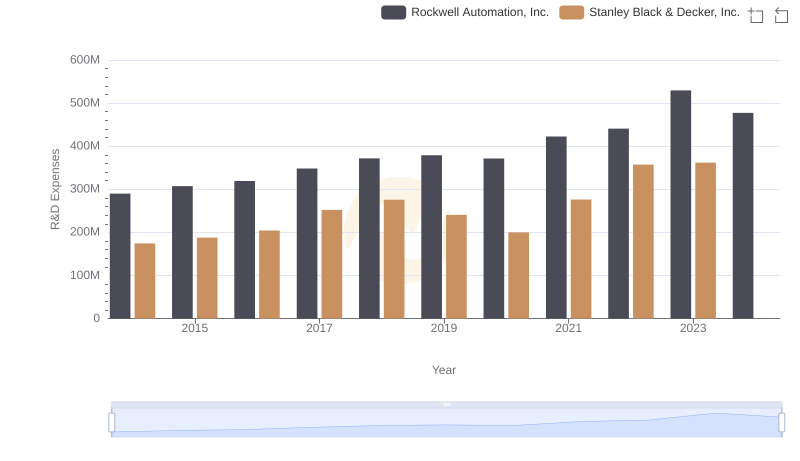
Rockwell Automation, Inc. or Stanley Black & Decker, Inc.: Who Invests More in Innovation?

Who Optimizes SG&A Costs Better? Rockwell Automation, Inc. or Stanley Black & Decker, Inc.
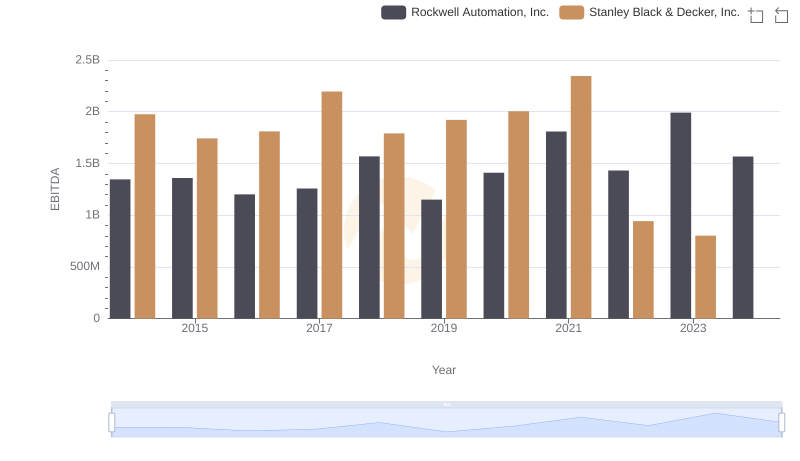
Comprehensive EBITDA Comparison: Rockwell Automation, Inc. vs Stanley Black & Decker, Inc.