| __timestamp | ANSYS, Inc. | Cisco Systems, Inc. |
|---|---|---|
| Wednesday, January 1, 2014 | 936021000 | 47142000000 |
| Thursday, January 1, 2015 | 942753000 | 49161000000 |
| Friday, January 1, 2016 | 988465000 | 49247000000 |
| Sunday, January 1, 2017 | 1095250000 | 48005000000 |
| Monday, January 1, 2018 | 1293636000 | 49330000000 |
| Tuesday, January 1, 2019 | 1515892000 | 51904000000 |
| Wednesday, January 1, 2020 | 1681297000 | 49301000000 |
| Friday, January 1, 2021 | 1906715000 | 49818000000 |
| Saturday, January 1, 2022 | 2065553000 | 51557000000 |
| Sunday, January 1, 2023 | 2269949000 | 56998000000 |
| Monday, January 1, 2024 | 2544809000 | 53803000000 |
Unlocking the unknown
In the ever-evolving tech industry, understanding revenue trends is crucial for investors and analysts alike. This chart offers a decade-long glimpse into the financial trajectories of two industry giants: Cisco Systems, Inc. and ANSYS, Inc. From 2014 to 2023, Cisco's revenue consistently dwarfed that of ANSYS, with Cisco's earnings peaking at approximately $57 billion in 2023, a 21% increase from 2014. Meanwhile, ANSYS demonstrated a steady growth trajectory, with revenues rising by 142% over the same period, reaching around $2.27 billion in 2023. This stark contrast highlights Cisco's dominance in the market, yet underscores ANSYS's impressive growth rate. Notably, the data for 2024 is incomplete, leaving room for speculation on future trends. As the tech landscape continues to shift, these insights provide a valuable lens through which to view the financial health and potential of these companies.
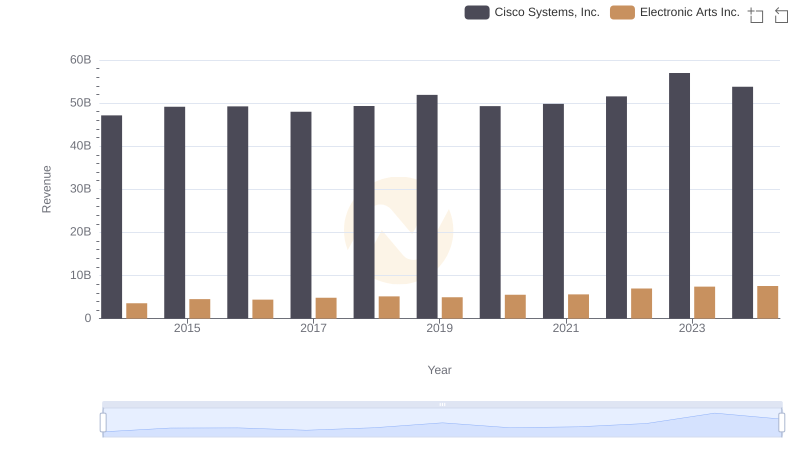
Cisco Systems, Inc. or Electronic Arts Inc.: Who Leads in Yearly Revenue?
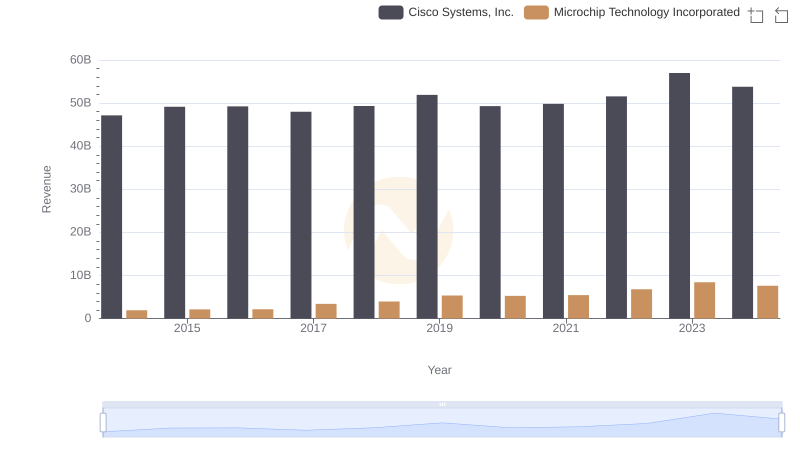
Breaking Down Revenue Trends: Cisco Systems, Inc. vs Microchip Technology Incorporated
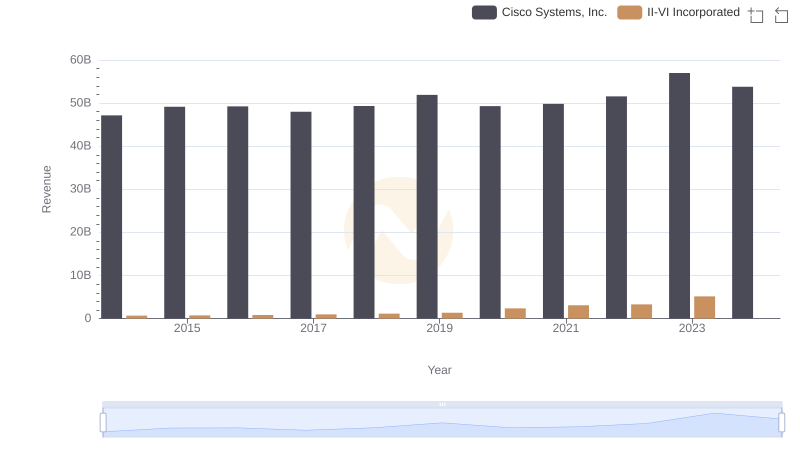
Who Generates More Revenue? Cisco Systems, Inc. or II-VI Incorporated
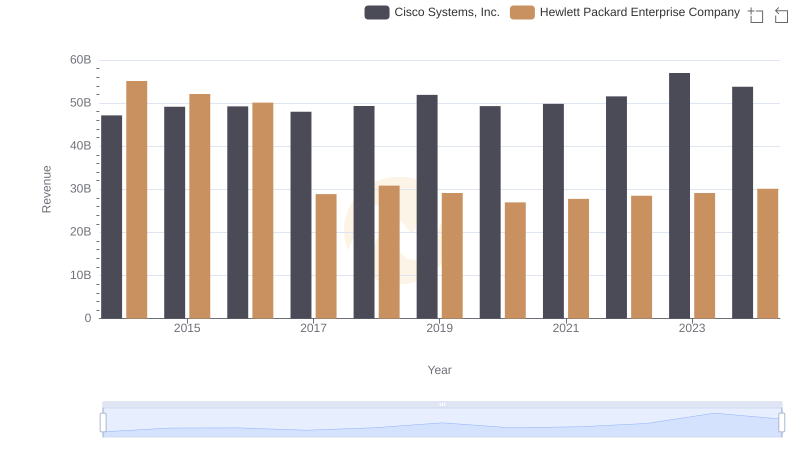
Who Generates More Revenue? Cisco Systems, Inc. or Hewlett Packard Enterprise Company

Who Generates More Revenue? Cisco Systems, Inc. or Monolithic Power Systems, Inc.
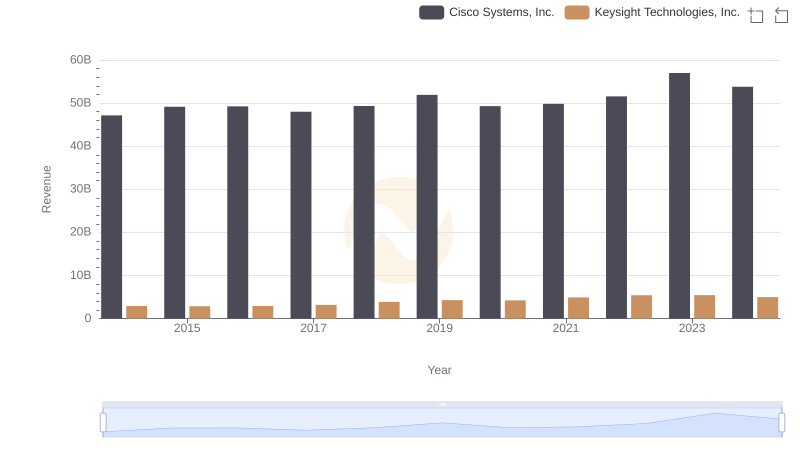
Cisco Systems, Inc. and Keysight Technologies, Inc.: A Comprehensive Revenue Analysis
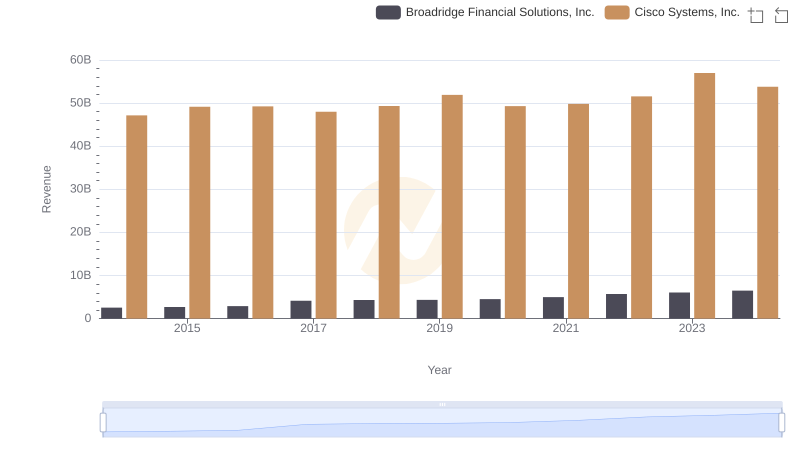
Cisco Systems, Inc. or Broadridge Financial Solutions, Inc.: Who Leads in Yearly Revenue?
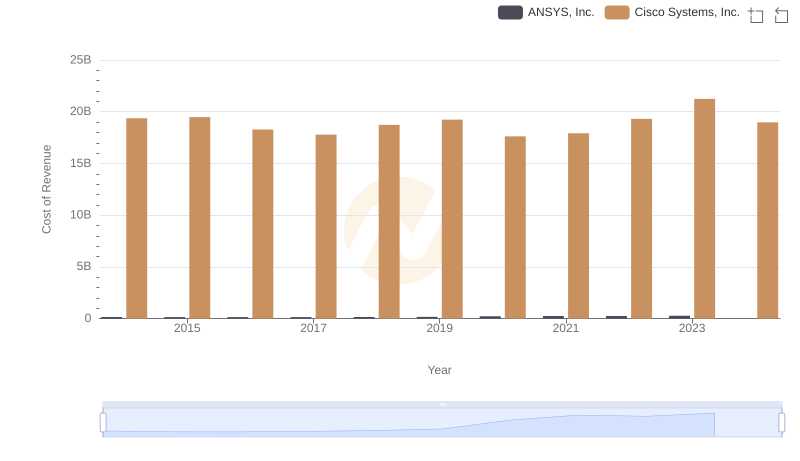
Cost of Revenue Trends: Cisco Systems, Inc. vs ANSYS, Inc.
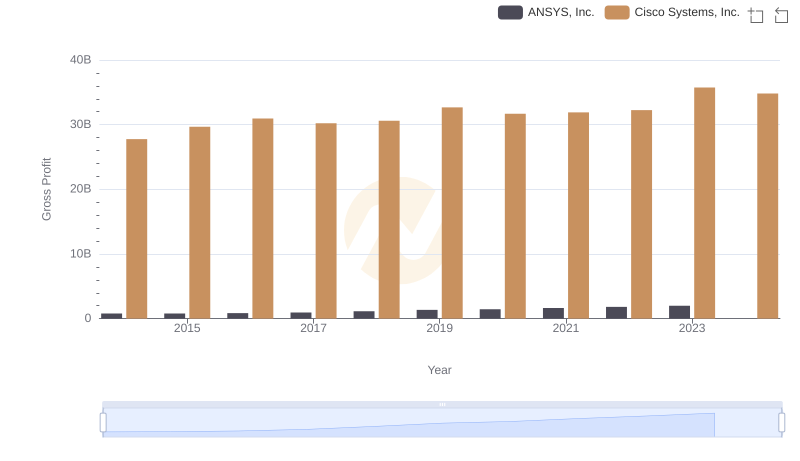
Key Insights on Gross Profit: Cisco Systems, Inc. vs ANSYS, Inc.
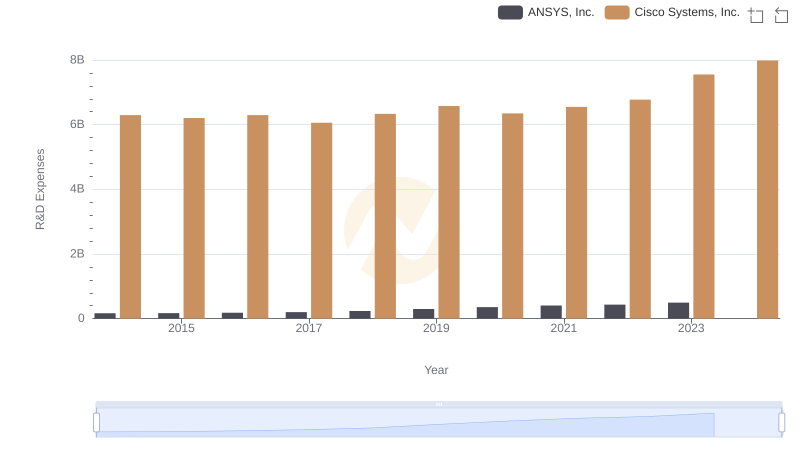
Comparing Innovation Spending: Cisco Systems, Inc. and ANSYS, Inc.
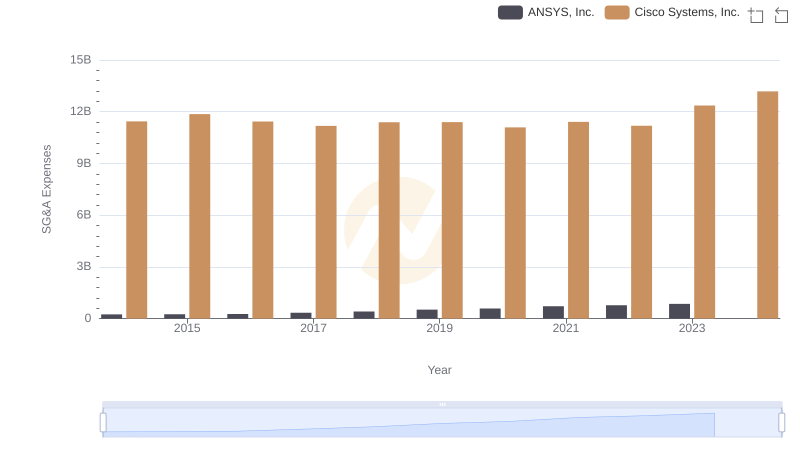
Cisco Systems, Inc. vs ANSYS, Inc.: SG&A Expense Trends
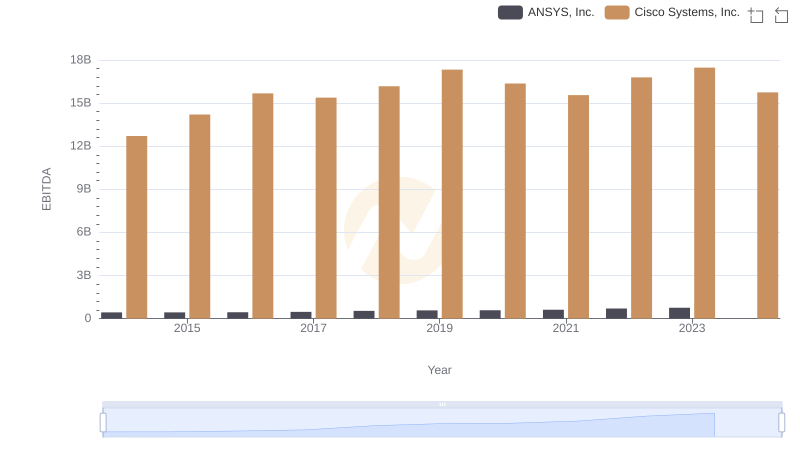
A Side-by-Side Analysis of EBITDA: Cisco Systems, Inc. and ANSYS, Inc.