| __timestamp | Automatic Data Processing, Inc. | Stanley Black & Decker, Inc. |
|---|---|---|
| Wednesday, January 1, 2014 | 2762400000 | 2595900000 |
| Thursday, January 1, 2015 | 2496900000 | 2486400000 |
| Friday, January 1, 2016 | 2637000000 | 2623900000 |
| Sunday, January 1, 2017 | 2783200000 | 2980100000 |
| Monday, January 1, 2018 | 2971500000 | 3171700000 |
| Tuesday, January 1, 2019 | 3064200000 | 3041000000 |
| Wednesday, January 1, 2020 | 3003000000 | 3089600000 |
| Friday, January 1, 2021 | 3040500000 | 3240400000 |
| Saturday, January 1, 2022 | 3233200000 | 3370000000 |
| Sunday, January 1, 2023 | 3551400000 | 2829300000 |
| Monday, January 1, 2024 | 3778900000 | 3310500000 |
Unleashing the power of data
In the ever-evolving landscape of corporate finance, understanding operational costs is crucial. This analysis delves into the Selling, General, and Administrative (SG&A) expenses of two industry giants: Automatic Data Processing, Inc. (ADP) and Stanley Black & Decker, Inc. Over the past decade, ADP has consistently increased its SG&A expenses, peaking in 2024 with a 36% rise from 2014. In contrast, Stanley Black & Decker's expenses fluctuated, reaching their highest in 2022 before a notable decline in 2023. This divergence highlights differing strategic priorities and market responses. ADP's steady growth in expenses suggests a focus on expansion and innovation, while Stanley Black & Decker's variability may reflect adaptive strategies in a dynamic market. Missing data for 2024 in Stanley Black & Decker's records suggests a need for further investigation into their financial strategies.
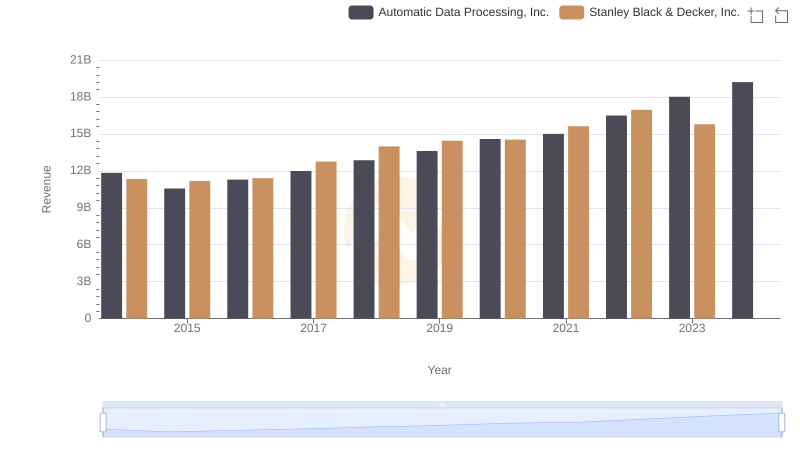
Revenue Insights: Automatic Data Processing, Inc. and Stanley Black & Decker, Inc. Performance Compared
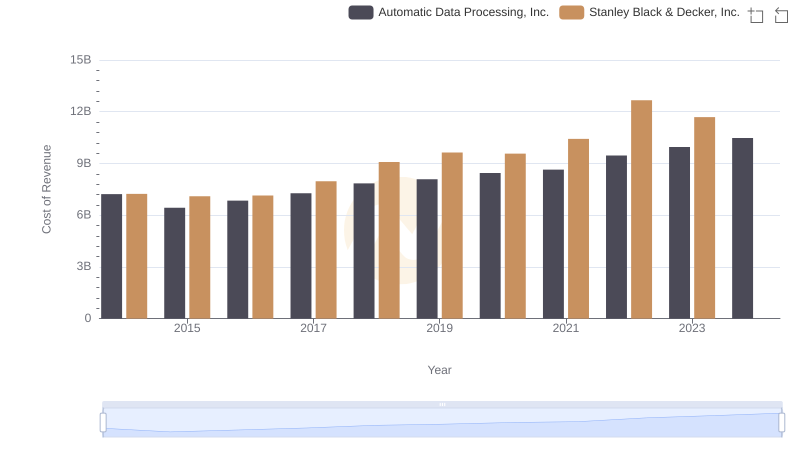
Automatic Data Processing, Inc. vs Stanley Black & Decker, Inc.: Efficiency in Cost of Revenue Explored

Gross Profit Analysis: Comparing Automatic Data Processing, Inc. and Stanley Black & Decker, Inc.
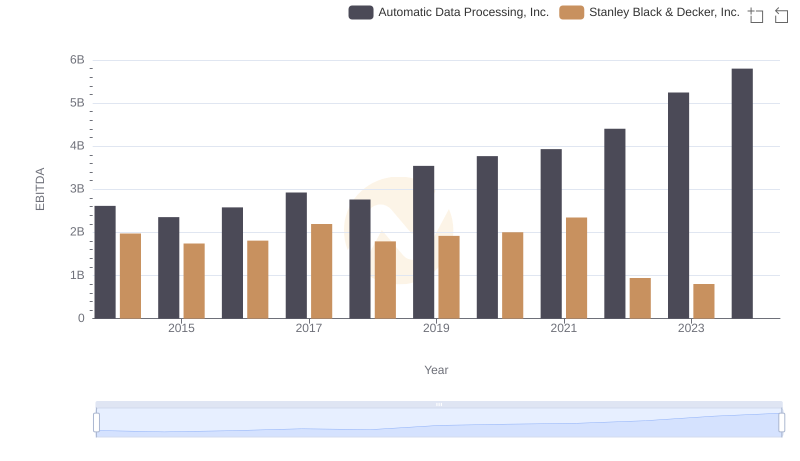
A Side-by-Side Analysis of EBITDA: Automatic Data Processing, Inc. and Stanley Black & Decker, Inc.
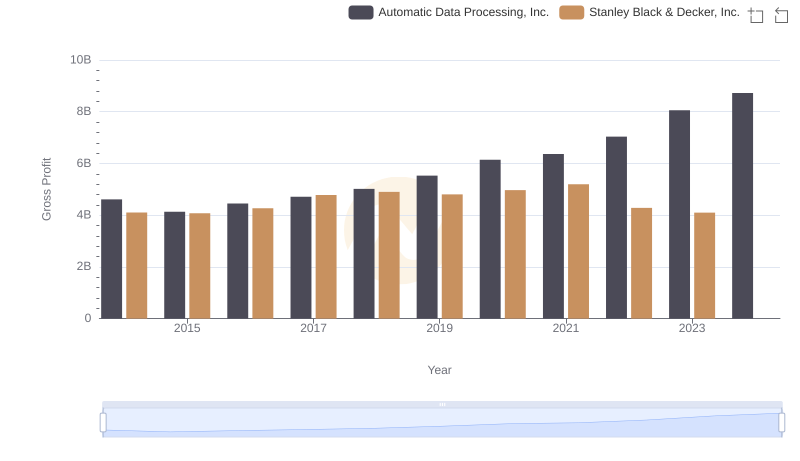
Key Insights on Gross Profit: Automatic Data Processing, Inc. vs Stanley Black & Decker, Inc.
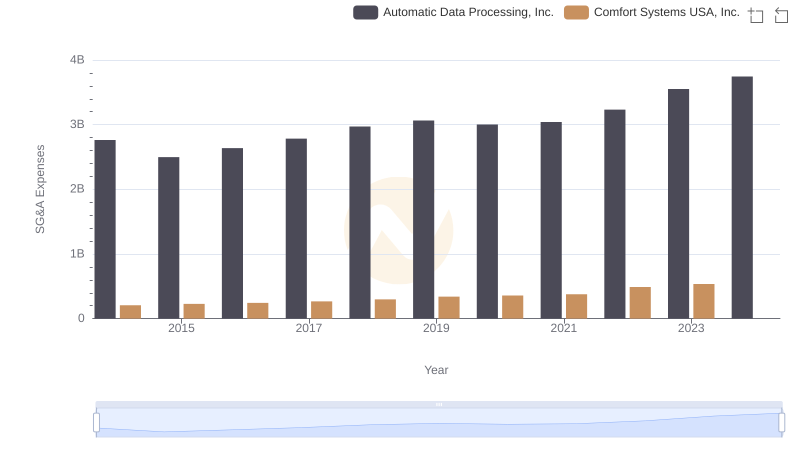
Automatic Data Processing, Inc. or Comfort Systems USA, Inc.: Who Manages SG&A Costs Better?
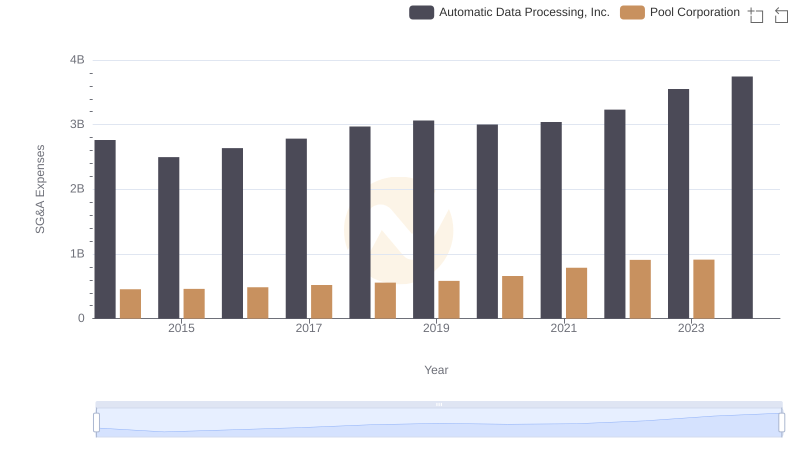
Cost Management Insights: SG&A Expenses for Automatic Data Processing, Inc. and Pool Corporation

Automatic Data Processing, Inc. vs Stanley Black & Decker, Inc.: In-Depth EBITDA Performance Comparison