| __timestamp | Automatic Data Processing, Inc. | Stanley Black & Decker, Inc. |
|---|---|---|
| Wednesday, January 1, 2014 | 11832800000 | 11338600000 |
| Thursday, January 1, 2015 | 10560800000 | 11171800000 |
| Friday, January 1, 2016 | 11290500000 | 11406900000 |
| Sunday, January 1, 2017 | 11982400000 | 12747200000 |
| Monday, January 1, 2018 | 12859300000 | 13982400000 |
| Tuesday, January 1, 2019 | 13613300000 | 14442200000 |
| Wednesday, January 1, 2020 | 14589800000 | 14534600000 |
| Friday, January 1, 2021 | 15005400000 | 15617200000 |
| Saturday, January 1, 2022 | 16498300000 | 16947400000 |
| Sunday, January 1, 2023 | 18012200000 | 15781100000 |
| Monday, January 1, 2024 | 19202600000 | 15365700000 |
Unleashing insights
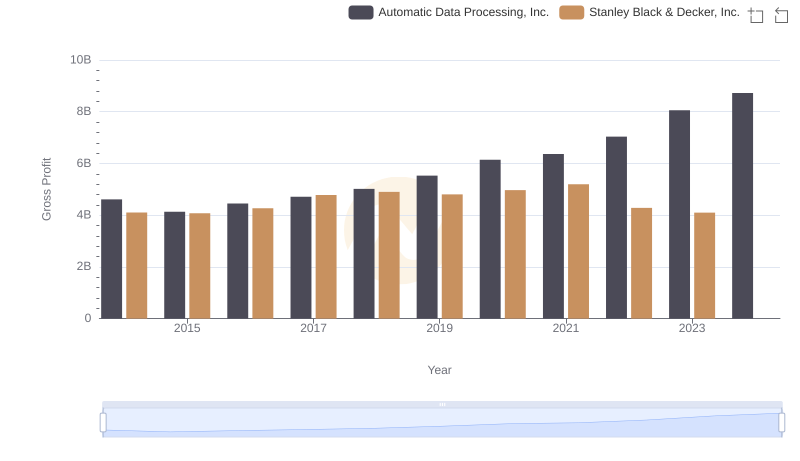
In the ever-evolving landscape of the corporate world, Automatic Data Processing, Inc. (ADP) and Stanley Black & Decker, Inc. have consistently demonstrated their prowess. Over the past decade, ADP has seen a remarkable revenue growth of approximately 63%, starting from 2014 to 2023. This growth trajectory highlights ADP's strategic adaptability and market resilience.
Conversely, Stanley Black & Decker, Inc. has shown a steady revenue increase of around 39% from 2014 to 2022, before experiencing a slight dip in 2023. This fluctuation could be attributed to market dynamics or strategic shifts within the company.
Interestingly, while ADP's revenue continued to climb in 2024, data for Stanley Black & Decker, Inc. remains elusive, leaving room for speculation. As these industry titans navigate the future, their financial narratives offer valuable insights into their strategic directions and market positions.

Revenue Showdown: Automatic Data Processing, Inc. vs AerCap Holdings N.V.
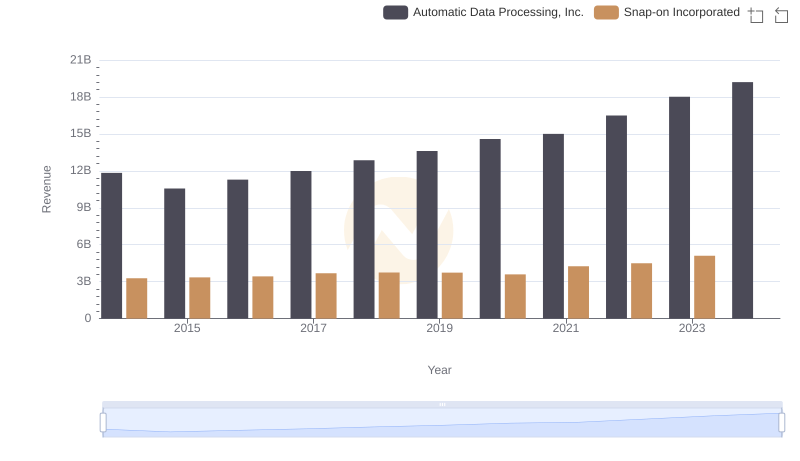
Breaking Down Revenue Trends: Automatic Data Processing, Inc. vs Snap-on Incorporated
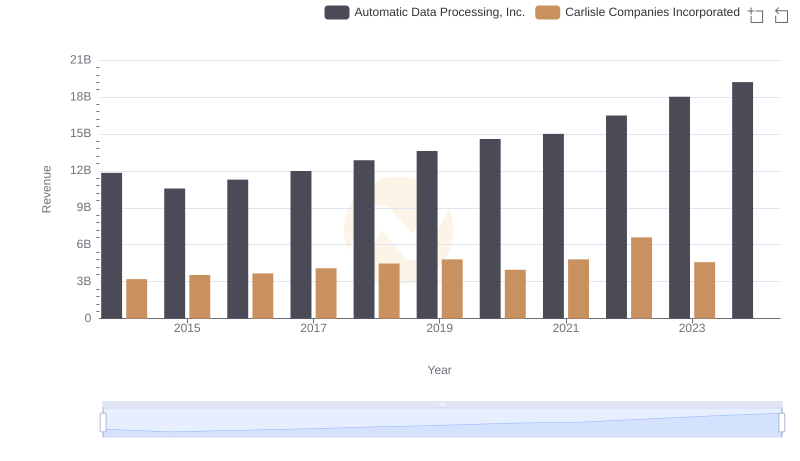
Automatic Data Processing, Inc. vs Carlisle Companies Incorporated: Examining Key Revenue Metrics
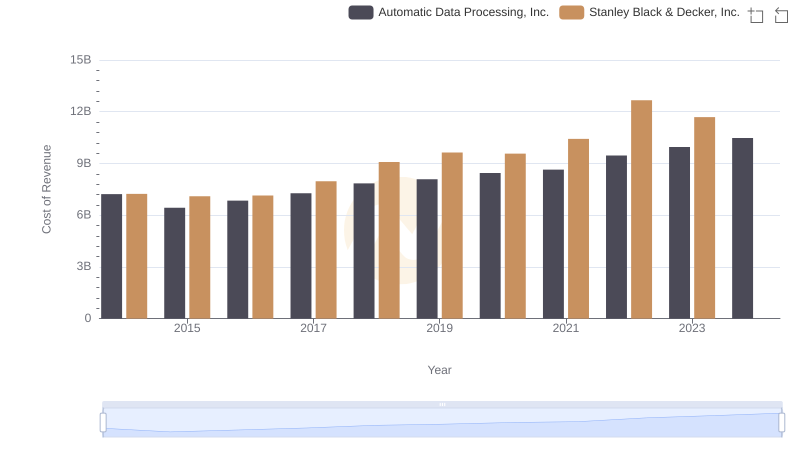
Automatic Data Processing, Inc. vs Stanley Black & Decker, Inc.: Efficiency in Cost of Revenue Explored

Gross Profit Analysis: Comparing Automatic Data Processing, Inc. and Stanley Black & Decker, Inc.
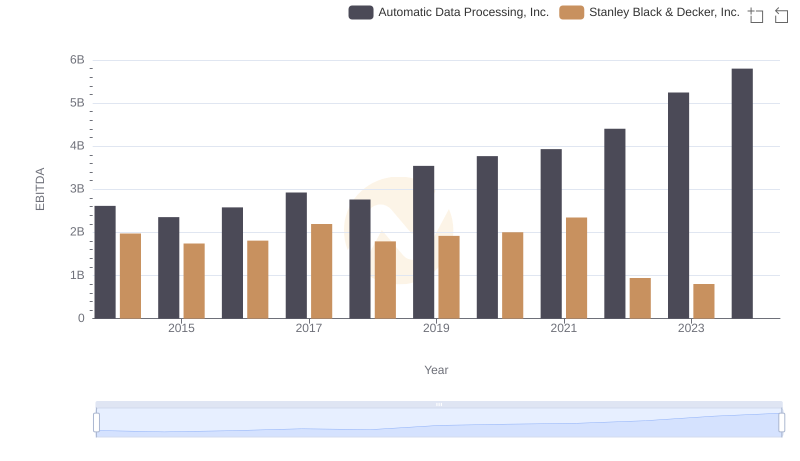
A Side-by-Side Analysis of EBITDA: Automatic Data Processing, Inc. and Stanley Black & Decker, Inc.
Key Insights on Gross Profit: Automatic Data Processing, Inc. vs Stanley Black & Decker, Inc.

Operational Costs Compared: SG&A Analysis of Automatic Data Processing, Inc. and Stanley Black & Decker, Inc.

Automatic Data Processing, Inc. vs Stanley Black & Decker, Inc.: In-Depth EBITDA Performance Comparison