| __timestamp | Avery Dennison Corporation | Waste Management, Inc. |
|---|---|---|
| Wednesday, January 1, 2014 | 629200000 | 3509000000 |
| Thursday, January 1, 2015 | 657700000 | 3342000000 |
| Friday, January 1, 2016 | 717000000 | 3713000000 |
| Sunday, January 1, 2017 | 829400000 | 3996000000 |
| Monday, January 1, 2018 | 794300000 | 4212000000 |
| Tuesday, January 1, 2019 | 557500000 | 4344000000 |
| Wednesday, January 1, 2020 | 1062000000 | 4149000000 |
| Friday, January 1, 2021 | 1306900000 | 4956000000 |
| Saturday, January 1, 2022 | 1374100000 | 5466000000 |
| Sunday, January 1, 2023 | 1112100000 | 5592000000 |
| Monday, January 1, 2024 | 1382700000 | 5128000000 |
Igniting the spark of knowledge
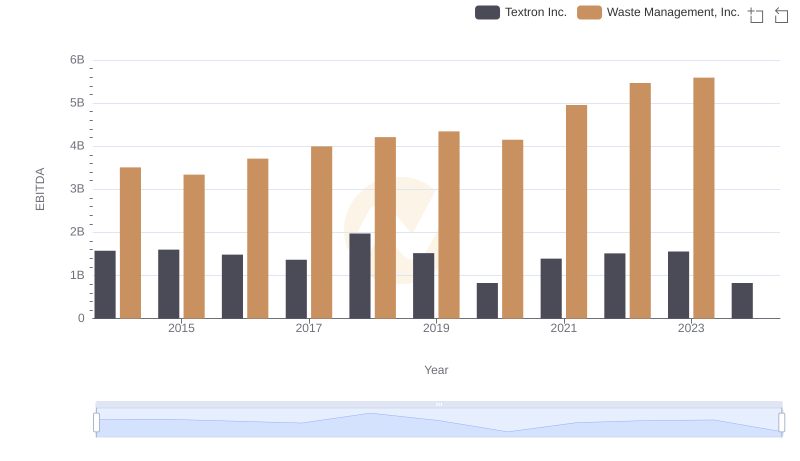
In the ever-evolving landscape of corporate finance, EBITDA (Earnings Before Interest, Taxes, Depreciation, and Amortization) serves as a crucial metric for evaluating a company's operational performance. Over the past decade, Waste Management, Inc. and Avery Dennison Corporation have demonstrated distinct trajectories in their EBITDA growth.
From 2014 to 2023, Waste Management, Inc. has consistently outperformed Avery Dennison Corporation, with an average EBITDA approximately five times higher. Notably, Waste Management's EBITDA surged by nearly 60% from 2014 to 2023, peaking at 5.6 billion in 2023. In contrast, Avery Dennison's EBITDA, while showing a commendable growth of over 75% during the same period, reached its highest point in 2022.
This analysis underscores the robust financial health of Waste Management, Inc., driven by strategic expansions and operational efficiencies, while Avery Dennison continues to innovate within its niche market.
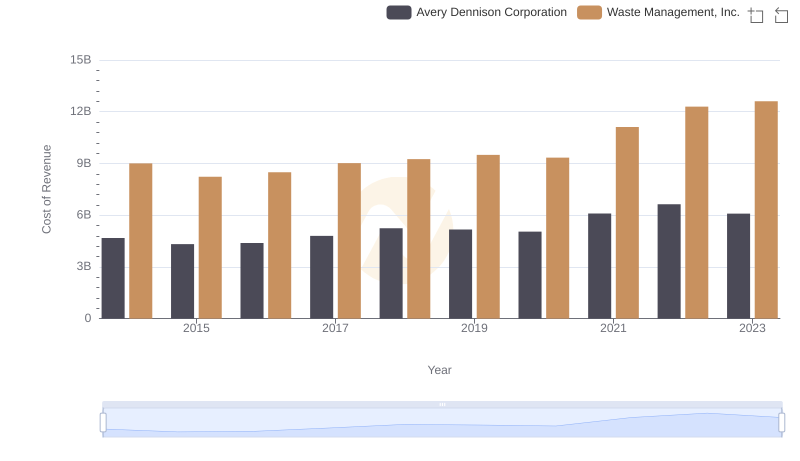
Cost Insights: Breaking Down Waste Management, Inc. and Avery Dennison Corporation's Expenses
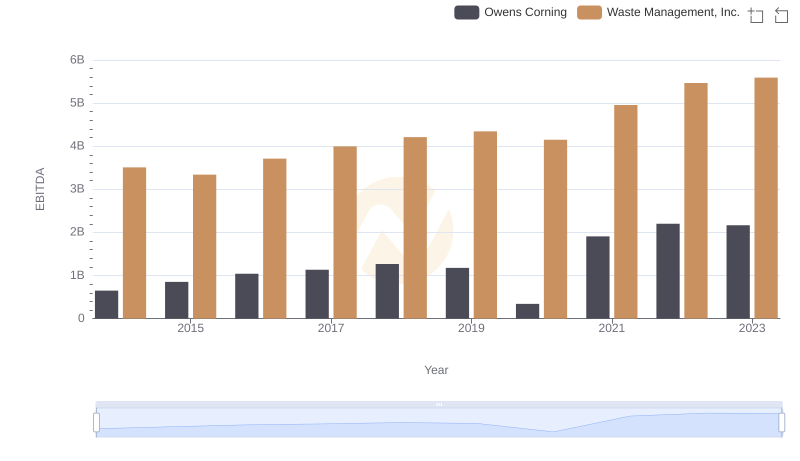
A Side-by-Side Analysis of EBITDA: Waste Management, Inc. and Owens Corning
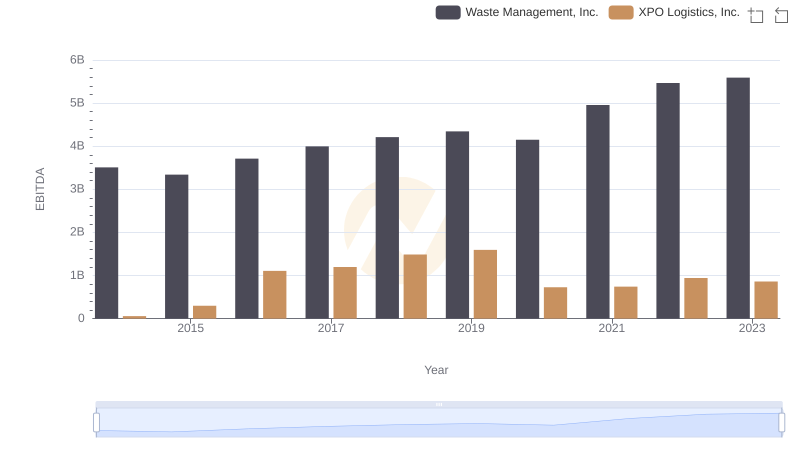
EBITDA Analysis: Evaluating Waste Management, Inc. Against XPO Logistics, Inc.
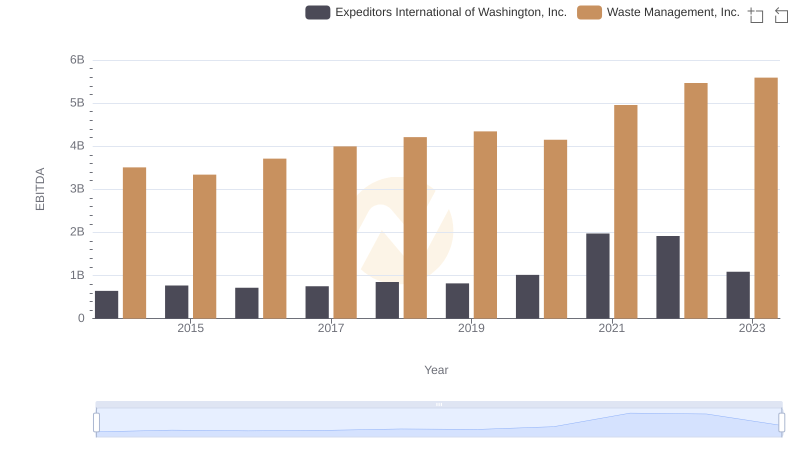
A Professional Review of EBITDA: Waste Management, Inc. Compared to Expeditors International of Washington, Inc.
Professional EBITDA Benchmarking: Waste Management, Inc. vs Textron Inc.

Waste Management, Inc. and Graco Inc.: A Detailed Examination of EBITDA Performance