| __timestamp | Textron Inc. | Waste Management, Inc. |
|---|---|---|
| Wednesday, January 1, 2014 | 1575000000 | 3509000000 |
| Thursday, January 1, 2015 | 1601000000 | 3342000000 |
| Friday, January 1, 2016 | 1484000000 | 3713000000 |
| Sunday, January 1, 2017 | 1367000000 | 3996000000 |
| Monday, January 1, 2018 | 1974000000 | 4212000000 |
| Tuesday, January 1, 2019 | 1518000000 | 4344000000 |
| Wednesday, January 1, 2020 | 827000000 | 4149000000 |
| Friday, January 1, 2021 | 1391000000 | 4956000000 |
| Saturday, January 1, 2022 | 1515000000 | 5466000000 |
| Sunday, January 1, 2023 | 1556000000 | 5592000000 |
| Monday, January 1, 2024 | 1422000000 | 5128000000 |
Data in motion
In the ever-evolving landscape of corporate finance, EBITDA serves as a crucial metric for evaluating a company's operational performance. This analysis juxtaposes the EBITDA of Waste Management, Inc. and Textron Inc. from 2014 to 2023, offering a decade-long perspective on their financial health.
Waste Management, Inc. has consistently outperformed Textron Inc., with its EBITDA growing by approximately 60% over the period, peaking at $5.6 billion in 2023. In contrast, Textron Inc. experienced a more volatile trajectory, with a notable dip in 2020, where EBITDA fell to nearly half of its 2018 peak. Despite this, Textron managed a recovery, closing 2023 with an EBITDA of $1.6 billion.
This comparison highlights Waste Management's robust growth and resilience, while Textron's journey underscores the challenges and recoveries typical in the industrial sector. Missing data for 2024 suggests ongoing developments worth monitoring.

Waste Management, Inc. vs Textron Inc.: Examining Key Revenue Metrics
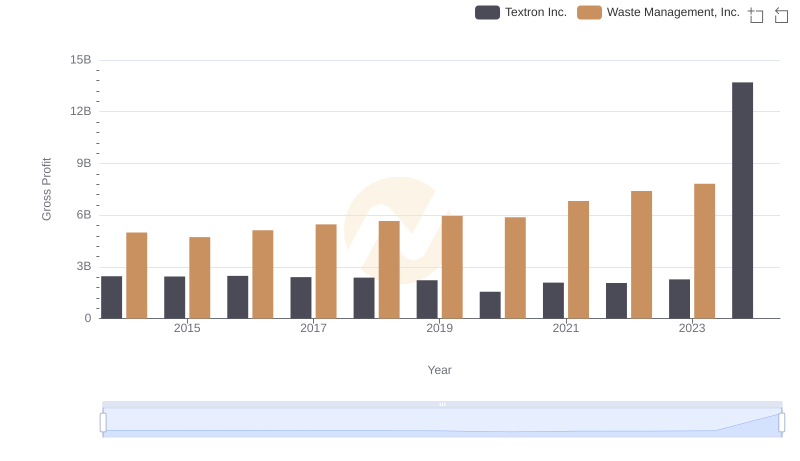
Waste Management, Inc. and Textron Inc.: A Detailed Gross Profit Analysis
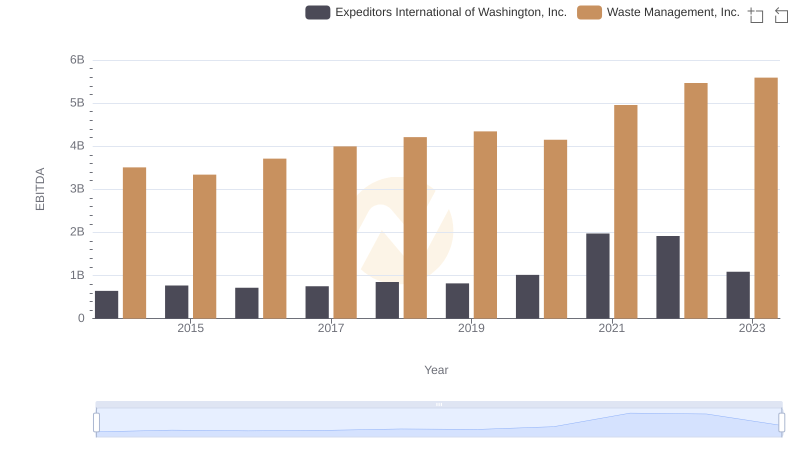
A Professional Review of EBITDA: Waste Management, Inc. Compared to Expeditors International of Washington, Inc.
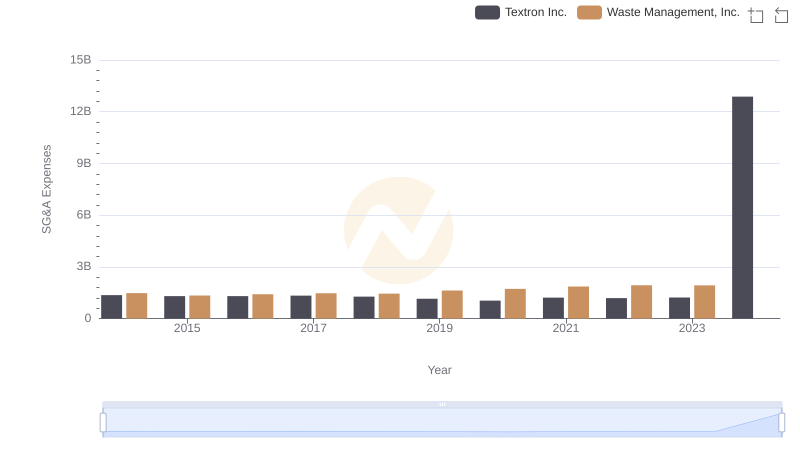
Waste Management, Inc. vs Textron Inc.: SG&A Expense Trends
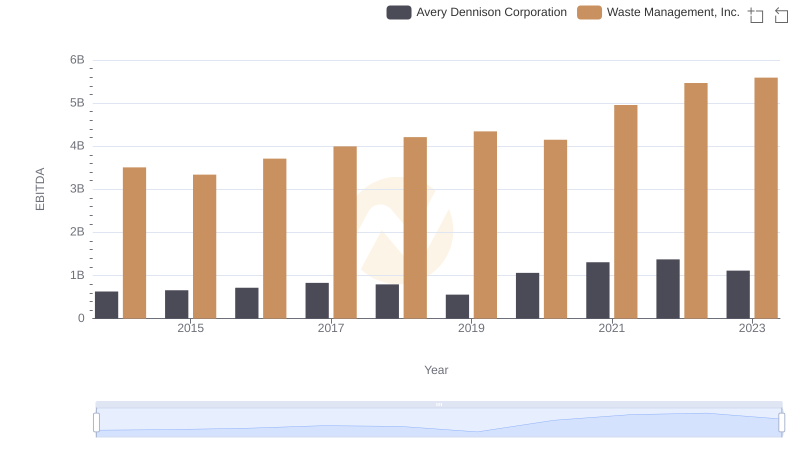
A Professional Review of EBITDA: Waste Management, Inc. Compared to Avery Dennison Corporation

Waste Management, Inc. and Graco Inc.: A Detailed Examination of EBITDA Performance
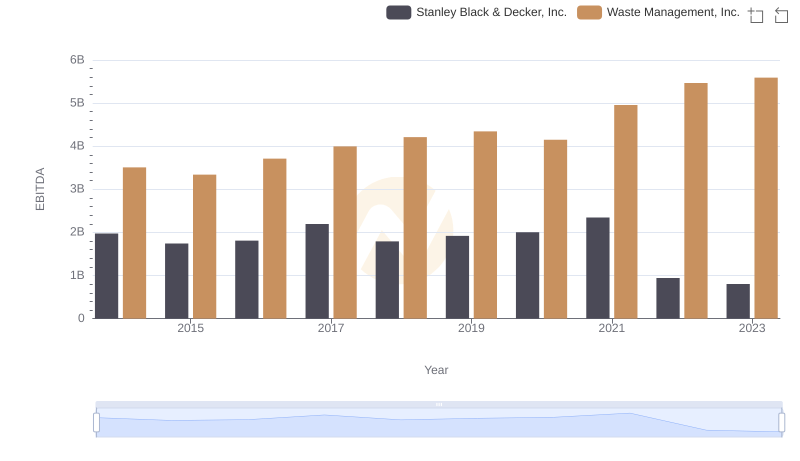
Comprehensive EBITDA Comparison: Waste Management, Inc. vs Stanley Black & Decker, Inc.
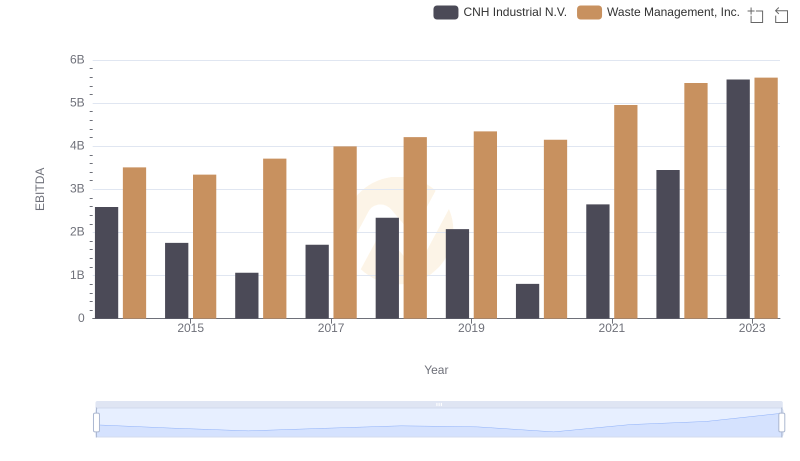
Waste Management, Inc. and CNH Industrial N.V.: A Detailed Examination of EBITDA Performance
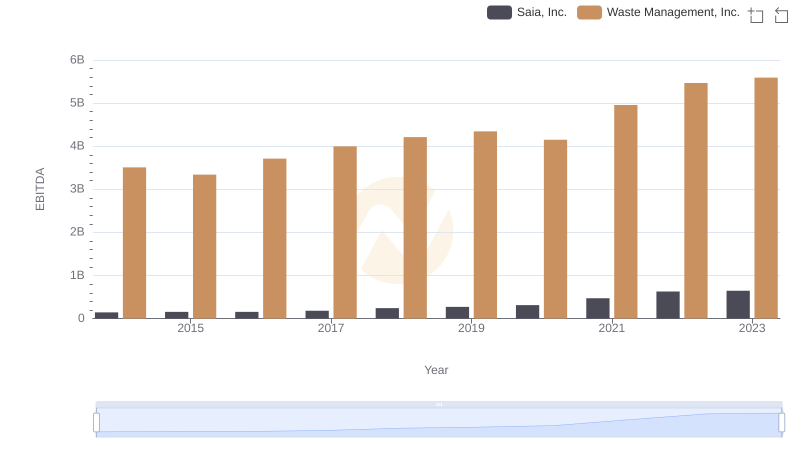
EBITDA Analysis: Evaluating Waste Management, Inc. Against Saia, Inc.