| __timestamp | Snap-on Incorporated | Trane Technologies plc |
|---|---|---|
| Wednesday, January 1, 2014 | 767600000 | 1757000000 |
| Thursday, January 1, 2015 | 848900000 | 1835000000 |
| Friday, January 1, 2016 | 942400000 | 2311000000 |
| Sunday, January 1, 2017 | 971900000 | 1982500000 |
| Monday, January 1, 2018 | 1057400000 | 2242400000 |
| Tuesday, January 1, 2019 | 1067000000 | 1931200000 |
| Wednesday, January 1, 2020 | 991400000 | 1831900000 |
| Friday, January 1, 2021 | 1249100000 | 2319200000 |
| Saturday, January 1, 2022 | 1351500000 | 2715500000 |
| Sunday, January 1, 2023 | 1478800000 | 3149900000 |
| Monday, January 1, 2024 | 1520700000 | 3859600000 |
Data in motion
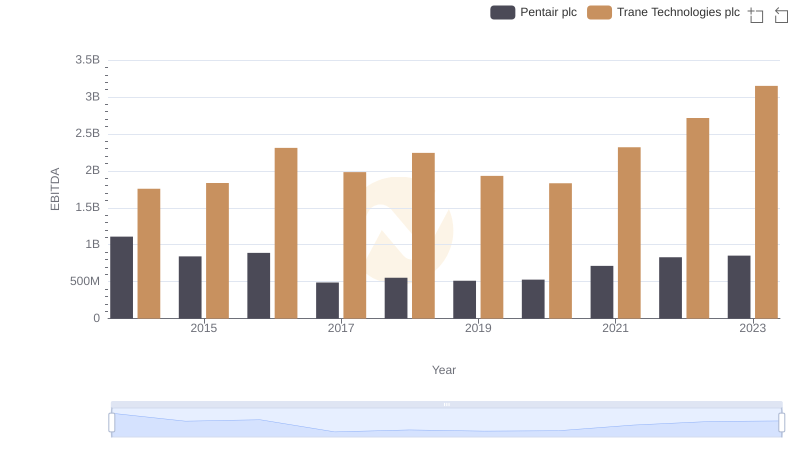
In the ever-evolving landscape of industrial giants, Trane Technologies plc and Snap-on Incorporated have showcased remarkable financial trajectories over the past decade. From 2014 to 2023, Trane Technologies has consistently outperformed Snap-on in terms of EBITDA, with a staggering 79% increase from 2014 to 2023. In 2023, Trane Technologies reached an EBITDA of approximately $3.15 billion, marking a significant growth from its 2014 figure of $1.76 billion.
Snap-on, while trailing behind, has demonstrated steady growth, achieving a 93% increase in EBITDA over the same period. By 2023, Snap-on's EBITDA rose to about $1.48 billion, up from $768 million in 2014. This financial journey highlights the resilience and strategic prowess of both companies in navigating market challenges and capitalizing on opportunities.
As we delve into these figures, it becomes evident that both companies have carved out their niches, with Trane Technologies leading the charge in EBITDA growth.
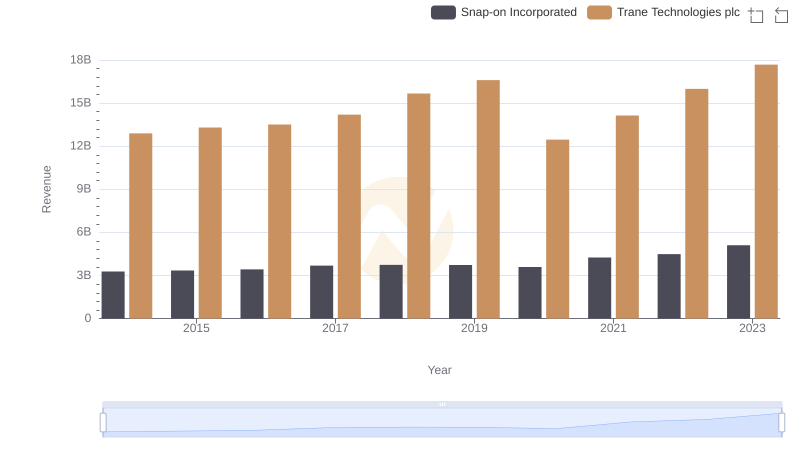
Annual Revenue Comparison: Trane Technologies plc vs Snap-on Incorporated
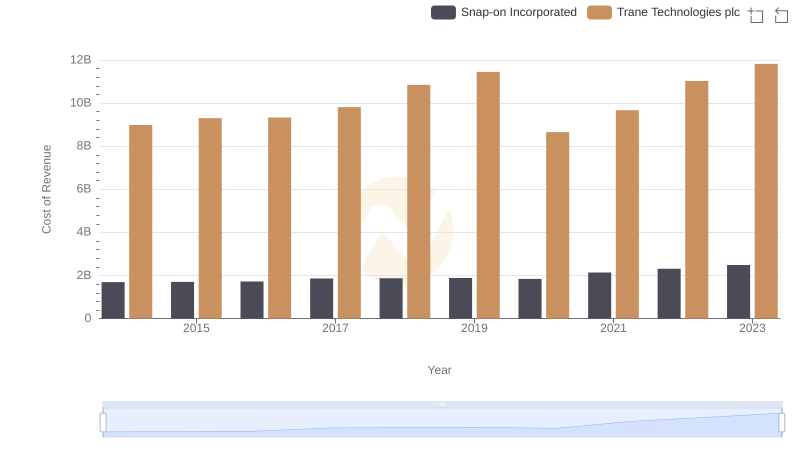
Cost Insights: Breaking Down Trane Technologies plc and Snap-on Incorporated's Expenses
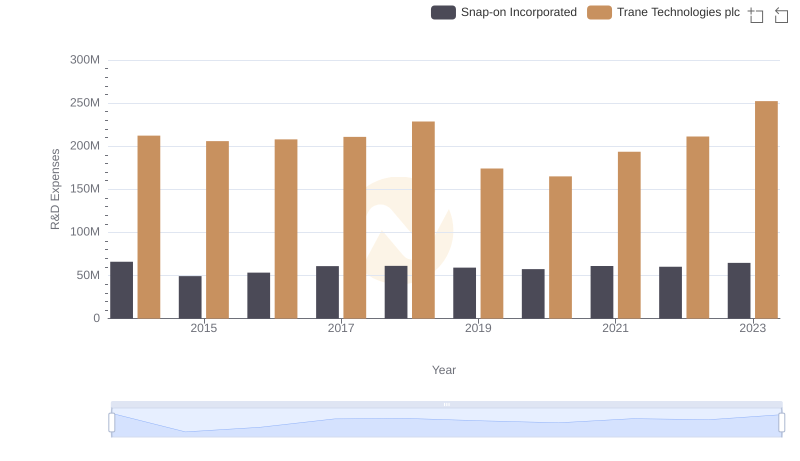
Who Prioritizes Innovation? R&D Spending Compared for Trane Technologies plc and Snap-on Incorporated
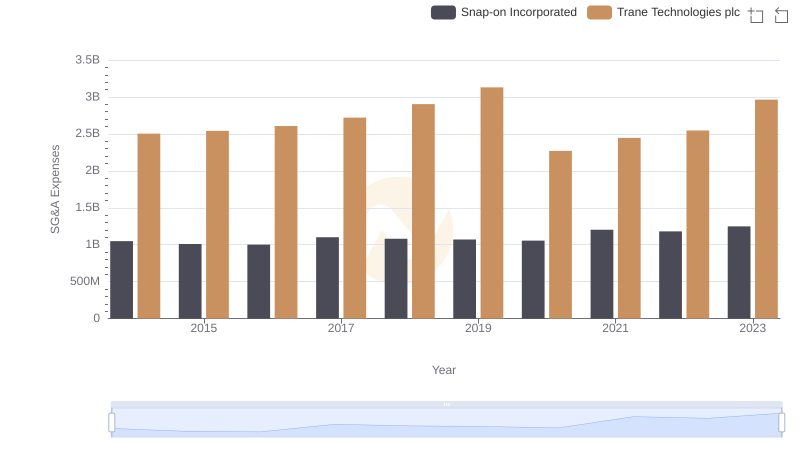
Breaking Down SG&A Expenses: Trane Technologies plc vs Snap-on Incorporated
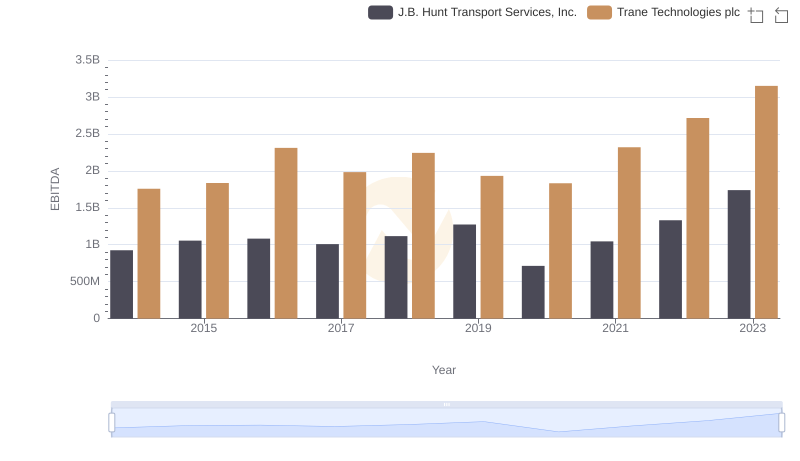
EBITDA Metrics Evaluated: Trane Technologies plc vs J.B. Hunt Transport Services, Inc.
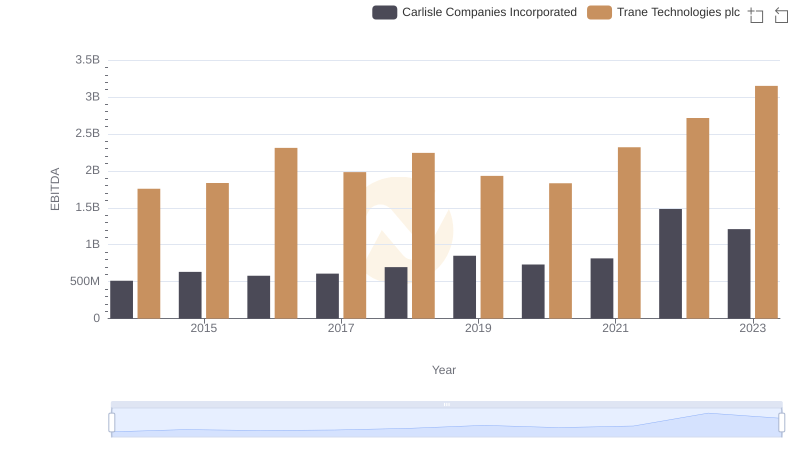
A Professional Review of EBITDA: Trane Technologies plc Compared to Carlisle Companies Incorporated
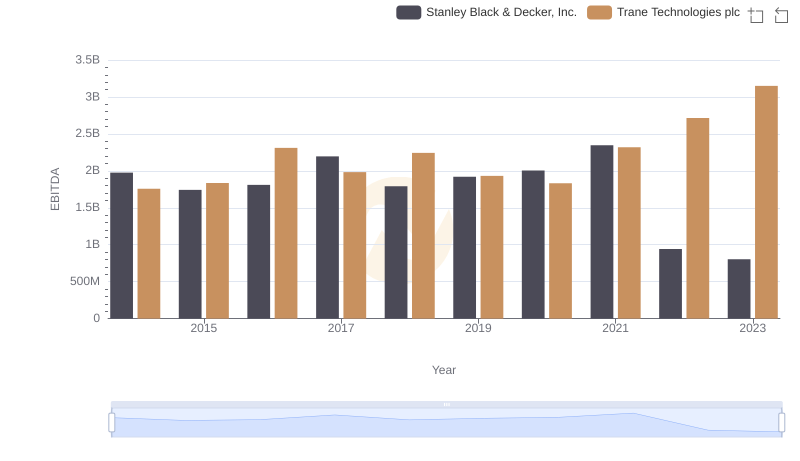
EBITDA Metrics Evaluated: Trane Technologies plc vs Stanley Black & Decker, Inc.

Professional EBITDA Benchmarking: Trane Technologies plc vs Booz Allen Hamilton Holding Corporation
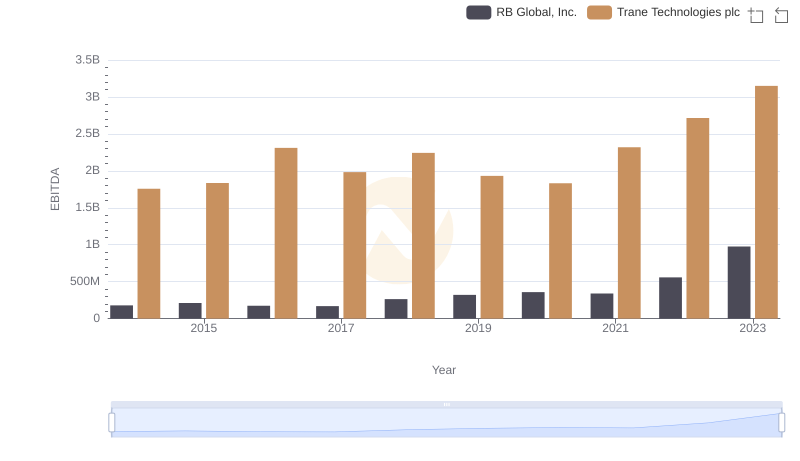
Comprehensive EBITDA Comparison: Trane Technologies plc vs RB Global, Inc.
EBITDA Performance Review: Trane Technologies plc vs Pentair plc