| __timestamp | Parker-Hannifin Corporation | Paychex, Inc. |
|---|---|---|
| Wednesday, January 1, 2014 | 1832903000 | 1082300000 |
| Thursday, January 1, 2015 | 1861551000 | 1153800000 |
| Friday, January 1, 2016 | 1558088000 | 1257200000 |
| Sunday, January 1, 2017 | 1846306000 | 1380800000 |
| Monday, January 1, 2018 | 2382235000 | 1429500000 |
| Tuesday, January 1, 2019 | 2513468000 | 1558100000 |
| Wednesday, January 1, 2020 | 2431500000 | 1670200000 |
| Friday, January 1, 2021 | 3092383000 | 1652700000 |
| Saturday, January 1, 2022 | 2441242000 | 2031800000 |
| Sunday, January 1, 2023 | 4071687000 | 2209700000 |
| Monday, January 1, 2024 | 5028229000 | 2350600000 |
Igniting the spark of knowledge
In the ever-evolving landscape of industrial and service sectors, Parker-Hannifin Corporation and Paychex, Inc. stand as titans of their respective fields. Over the past decade, Parker-Hannifin has demonstrated a remarkable growth trajectory in EBITDA, surging by approximately 175% from 2014 to 2024. This growth is particularly notable in the years 2023 and 2024, where EBITDA figures reached unprecedented heights, reflecting the company's strategic expansions and operational efficiencies.
Conversely, Paychex, Inc. has shown a steady yet modest increase of around 117% in the same period. This consistent growth underscores Paychex's resilience and adaptability in the competitive payroll and HR services market. The data highlights a compelling narrative of industrial prowess versus service sector stability, offering investors and analysts a nuanced perspective on these two industry leaders.
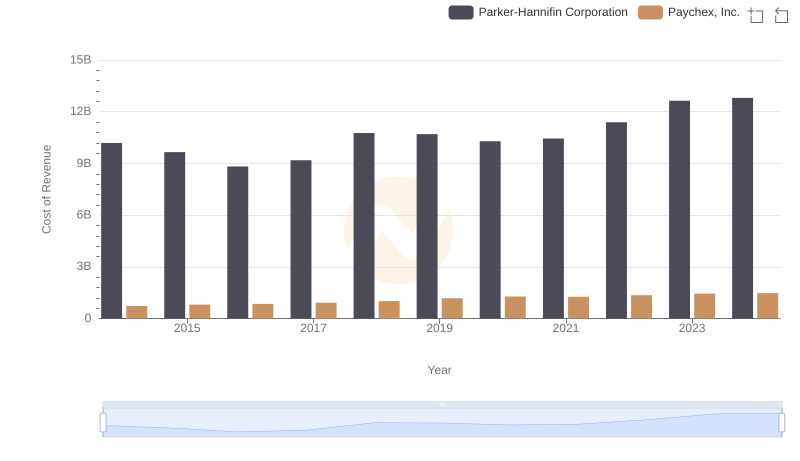
Comparing Cost of Revenue Efficiency: Parker-Hannifin Corporation vs Paychex, Inc.
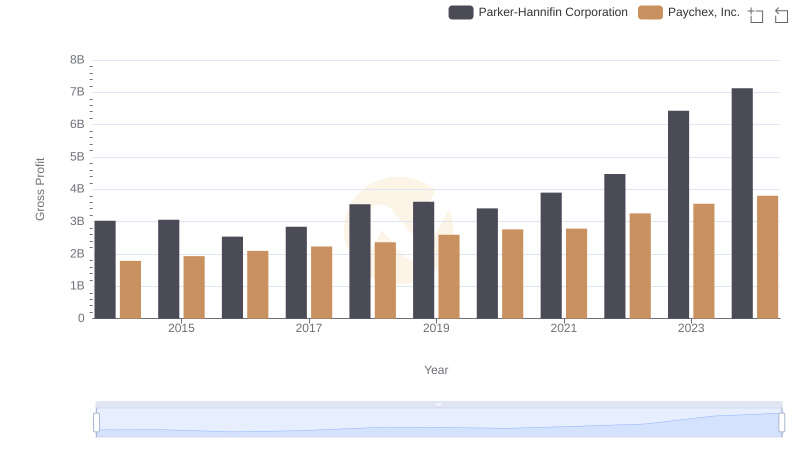
Who Generates Higher Gross Profit? Parker-Hannifin Corporation or Paychex, Inc.

EBITDA Metrics Evaluated: Parker-Hannifin Corporation vs Roper Technologies, Inc.
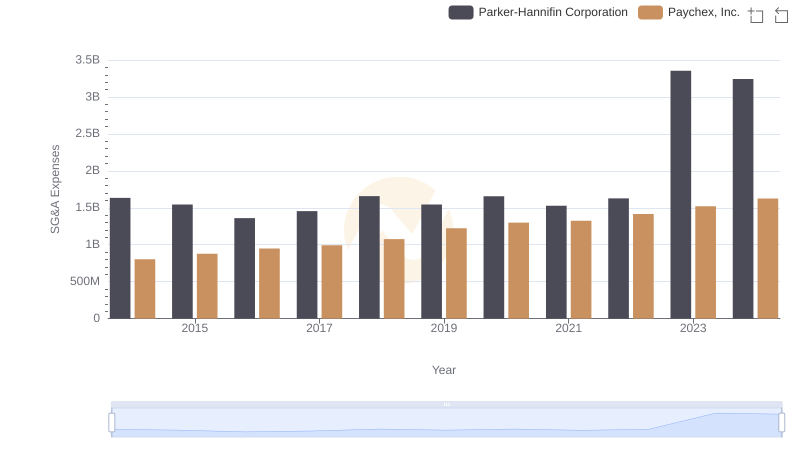
Operational Costs Compared: SG&A Analysis of Parker-Hannifin Corporation and Paychex, Inc.
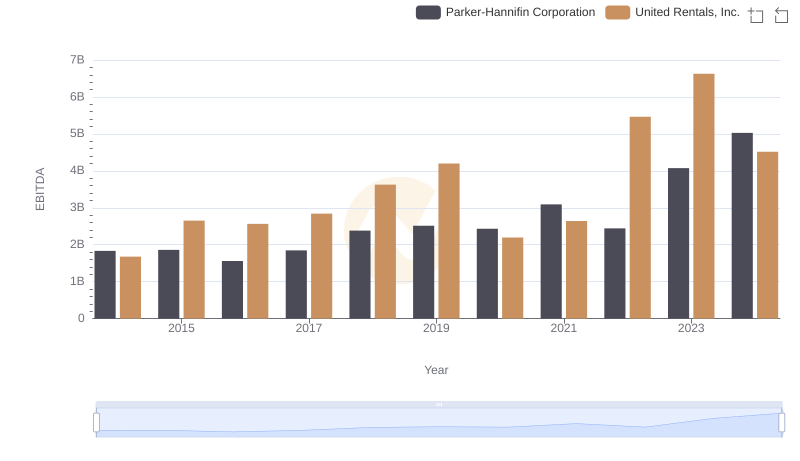
A Professional Review of EBITDA: Parker-Hannifin Corporation Compared to United Rentals, Inc.
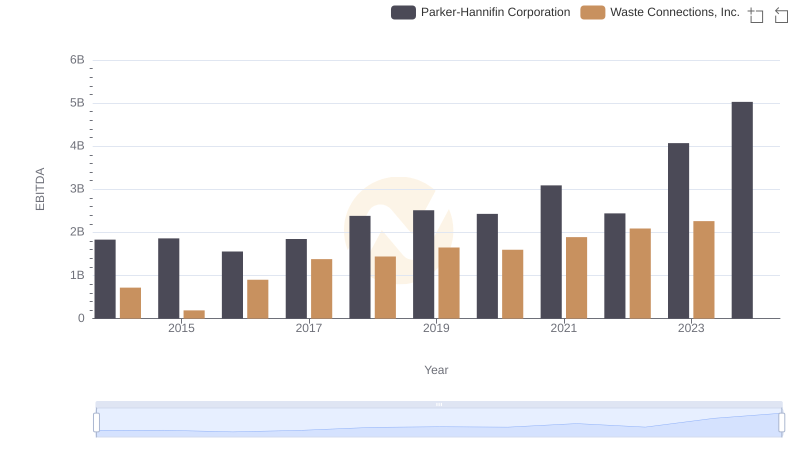
Professional EBITDA Benchmarking: Parker-Hannifin Corporation vs Waste Connections, Inc.
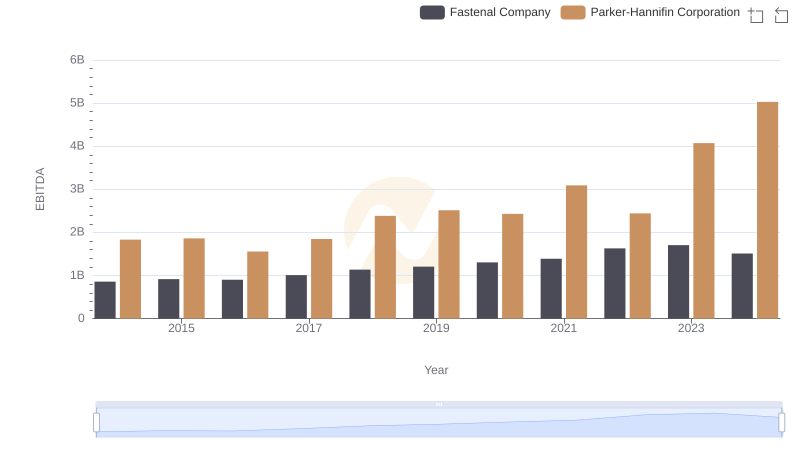
Parker-Hannifin Corporation and Fastenal Company: A Detailed Examination of EBITDA Performance
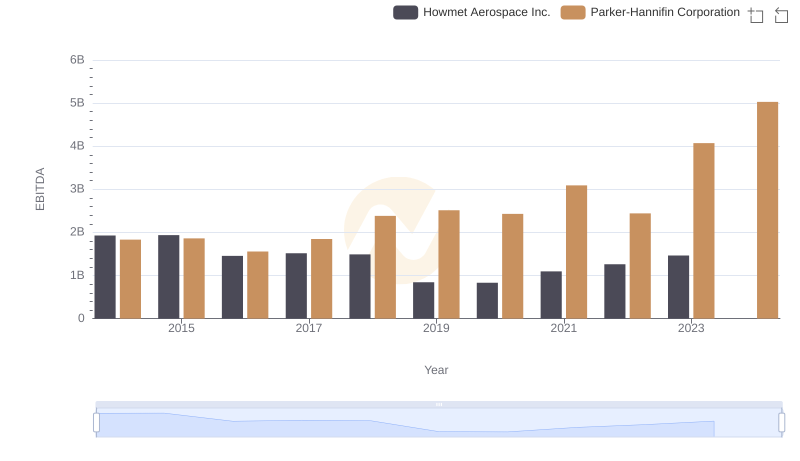
A Side-by-Side Analysis of EBITDA: Parker-Hannifin Corporation and Howmet Aerospace Inc.
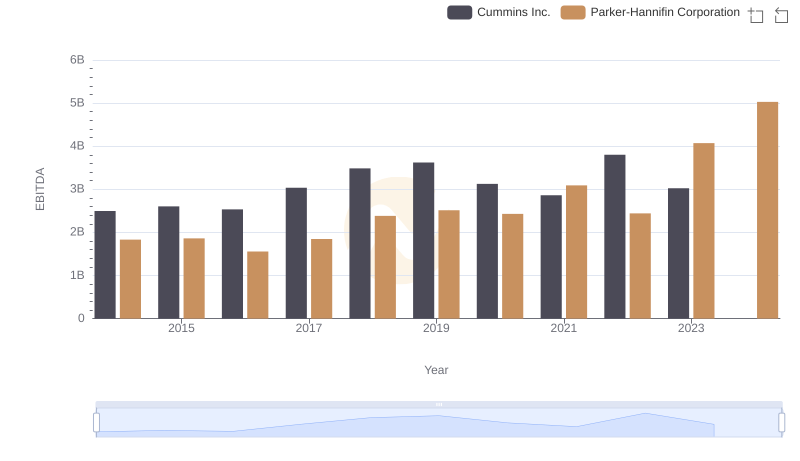
A Professional Review of EBITDA: Parker-Hannifin Corporation Compared to Cummins Inc.