| __timestamp | CSX Corporation | Stanley Black & Decker, Inc. |
|---|---|---|
| Wednesday, January 1, 2014 | 12669000000 | 11338600000 |
| Thursday, January 1, 2015 | 11811000000 | 11171800000 |
| Friday, January 1, 2016 | 11069000000 | 11406900000 |
| Sunday, January 1, 2017 | 11408000000 | 12747200000 |
| Monday, January 1, 2018 | 12250000000 | 13982400000 |
| Tuesday, January 1, 2019 | 11937000000 | 14442200000 |
| Wednesday, January 1, 2020 | 10583000000 | 14534600000 |
| Friday, January 1, 2021 | 12522000000 | 15617200000 |
| Saturday, January 1, 2022 | 14853000000 | 16947400000 |
| Sunday, January 1, 2023 | 14657000000 | 15781100000 |
| Monday, January 1, 2024 | 15365700000 |
Unveiling the hidden dimensions of data
In the ever-evolving landscape of American industry, CSX Corporation and Stanley Black & Decker, Inc. stand as titans in their respective fields. Over the past decade, from 2014 to 2023, these companies have showcased intriguing revenue trajectories. CSX Corporation, a leader in rail transportation, saw its revenue fluctuate, peaking in 2022 with a 40% increase from its 2016 low. Meanwhile, Stanley Black & Decker, a global provider of tools and storage, consistently outpaced CSX, achieving a 50% revenue growth over the same period, with a notable peak in 2022. The data reveals a compelling narrative of resilience and adaptation, as both companies navigated economic shifts and market demands. This analysis not only highlights their financial performance but also underscores the broader economic trends influencing these industries.
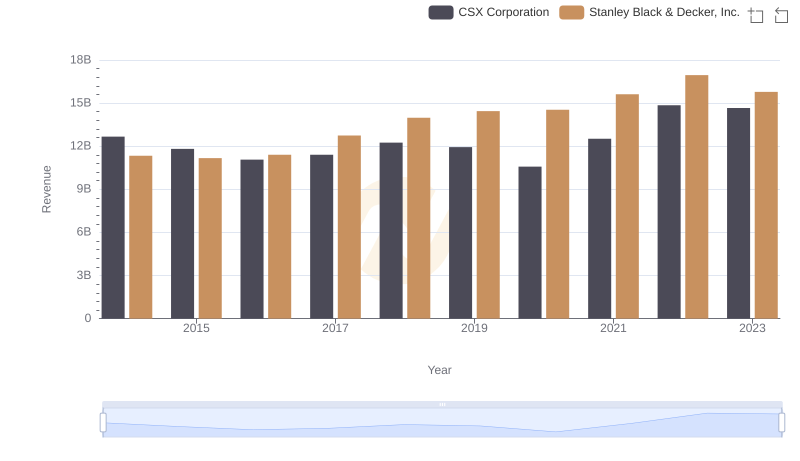
Revenue Insights: CSX Corporation and Stanley Black & Decker, Inc. Performance Compared
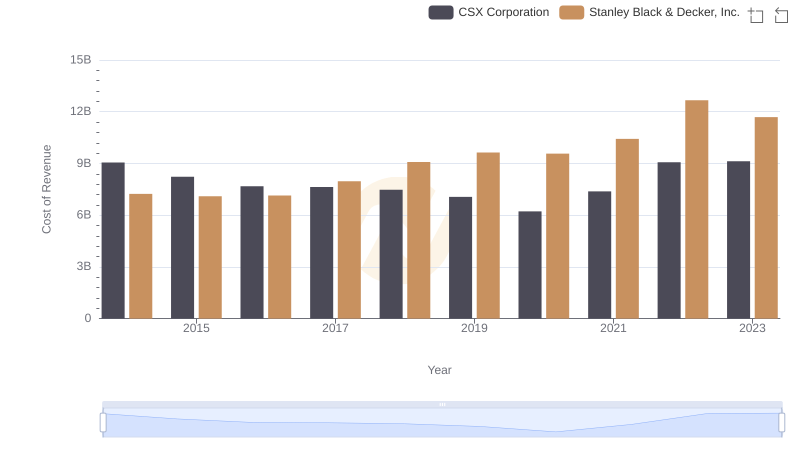
Cost Insights: Breaking Down CSX Corporation and Stanley Black & Decker, Inc.'s Expenses
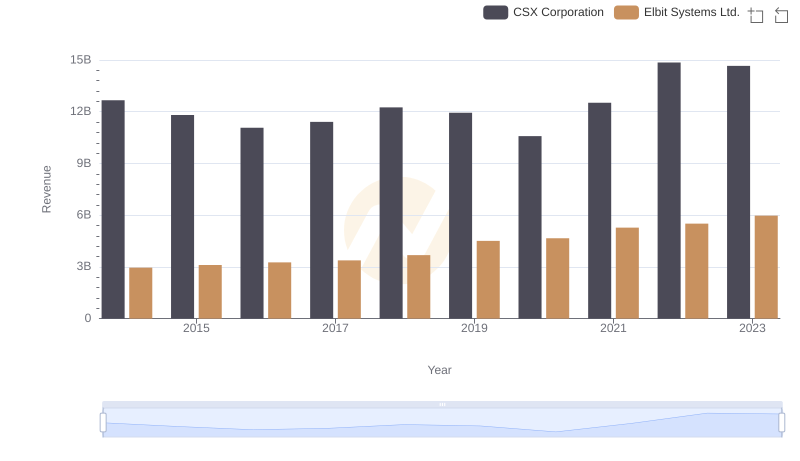
CSX Corporation vs Elbit Systems Ltd.: Annual Revenue Growth Compared
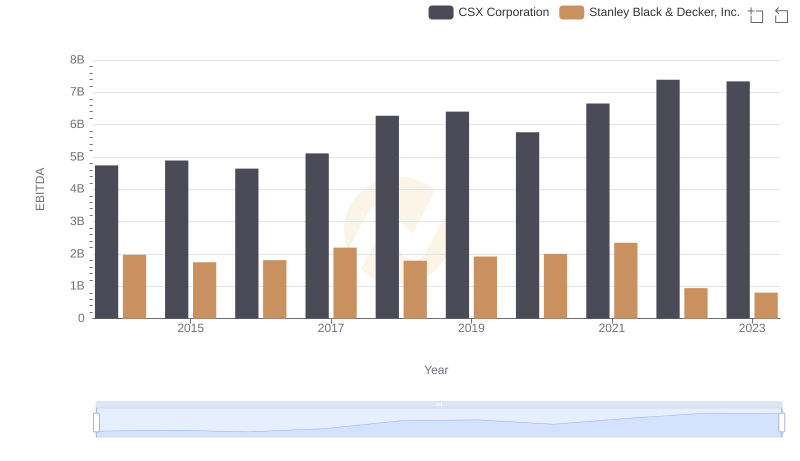
A Professional Review of EBITDA: CSX Corporation Compared to Stanley Black & Decker, Inc.