| __timestamp | CSX Corporation | Stanley Black & Decker, Inc. |
|---|---|---|
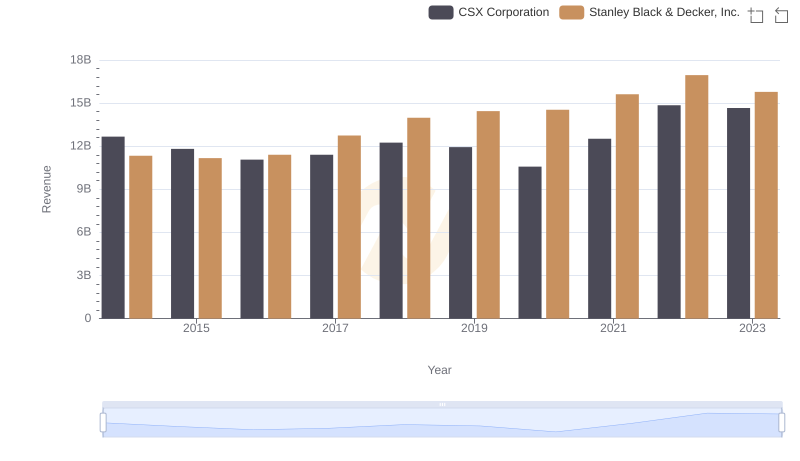
| Wednesday, January 1, 2014 | 12669000000 | 11338600000 |
| Thursday, January 1, 2015 | 11811000000 | 11171800000 |
| Friday, January 1, 2016 | 11069000000 | 11406900000 |
| Sunday, January 1, 2017 | 11408000000 | 12747200000 |
| Monday, January 1, 2018 | 12250000000 | 13982400000 |
| Tuesday, January 1, 2019 | 11937000000 | 14442200000 |
| Wednesday, January 1, 2020 | 10583000000 | 14534600000 |
| Friday, January 1, 2021 | 12522000000 | 15617200000 |
| Saturday, January 1, 2022 | 14853000000 | 16947400000 |
| Sunday, January 1, 2023 | 14657000000 | 15781100000 |
| Monday, January 1, 2024 | 15365700000 |
Cracking the code
In the ever-evolving landscape of American industry, CSX Corporation and Stanley Black & Decker, Inc. have showcased intriguing revenue trajectories over the past decade. From 2014 to 2023, CSX Corporation's revenue saw a steady climb, peaking in 2022 with a remarkable 40% increase from its 2016 low. Meanwhile, Stanley Black & Decker, Inc. experienced a robust growth of approximately 50% over the same period, reaching its zenith in 2022.
These trends underscore the dynamic nature of these industries, offering valuable insights for investors and industry watchers alike.