| __timestamp | Canadian National Railway Company | Clean Harbors, Inc. |
|---|---|---|
| Wednesday, January 1, 2014 | 5674000000 | 393092000 |
| Thursday, January 1, 2015 | 6424000000 | 461019000 |
| Friday, January 1, 2016 | 6537000000 | 380027000 |
| Sunday, January 1, 2017 | 6839000000 | 411975000 |
| Monday, January 1, 2018 | 7124000000 | 477159000 |
| Tuesday, January 1, 2019 | 7999000000 | 531861000 |
| Wednesday, January 1, 2020 | 7652000000 | 544047000 |
| Friday, January 1, 2021 | 7607000000 | 647725000 |
| Saturday, January 1, 2022 | 9067000000 | 1011488000 |
| Sunday, January 1, 2023 | 9027000000 | 989565000 |
| Monday, January 1, 2024 | 799401000 |
Data in motion
In the ever-evolving landscape of North American industries, the financial performance of Canadian National Railway Company (CNR) and Clean Harbors, Inc. (CH) offers a fascinating study. Over the past decade, CNR has consistently outperformed CH in terms of EBITDA, showcasing a robust growth trajectory. From 2014 to 2023, CNR's EBITDA surged by approximately 59%, peaking in 2022 with a remarkable 9.07 billion USD. In contrast, CH experienced a more modest growth of around 160%, reaching its highest EBITDA of 1.01 billion USD in 2022. This disparity highlights CNR's dominant position in the transportation sector, while CH's steady rise underscores its resilience in environmental services. As we delve into these financial narratives, it becomes evident that strategic investments and market positioning play pivotal roles in shaping the financial destinies of these industry giants.
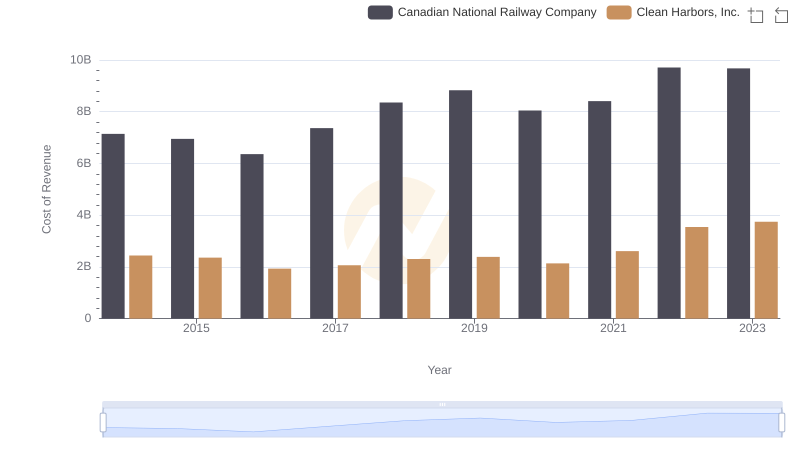
Analyzing Cost of Revenue: Canadian National Railway Company and Clean Harbors, Inc.
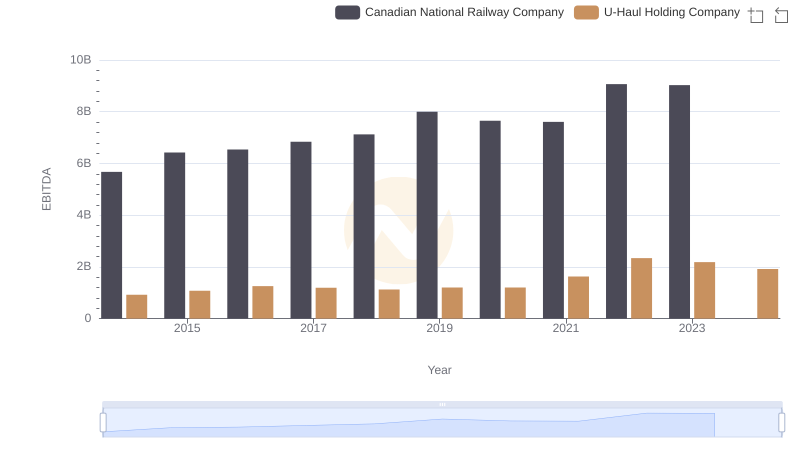
EBITDA Analysis: Evaluating Canadian National Railway Company Against U-Haul Holding Company
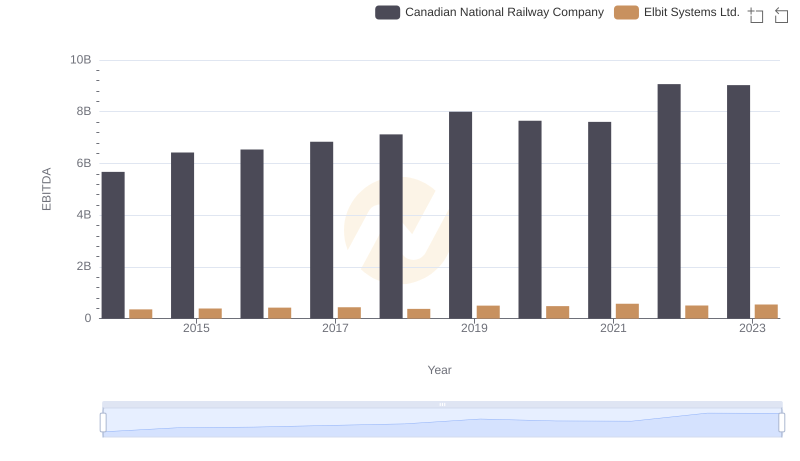
EBITDA Analysis: Evaluating Canadian National Railway Company Against Elbit Systems Ltd.
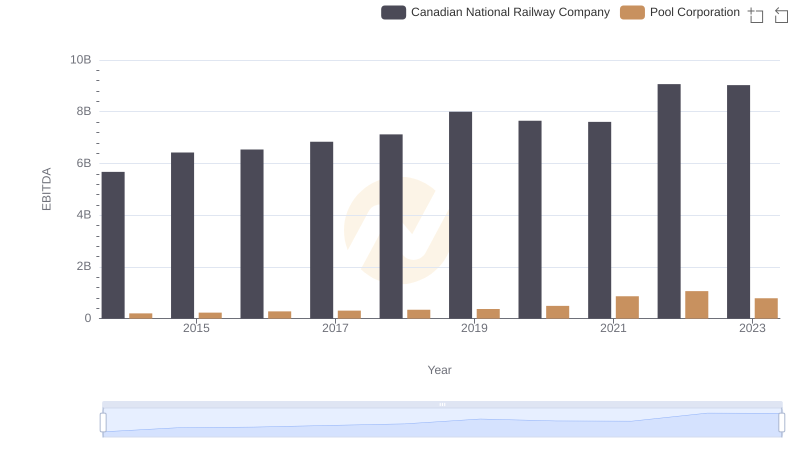
Professional EBITDA Benchmarking: Canadian National Railway Company vs Pool Corporation

Gross Profit Comparison: Canadian National Railway Company and Clean Harbors, Inc. Trends
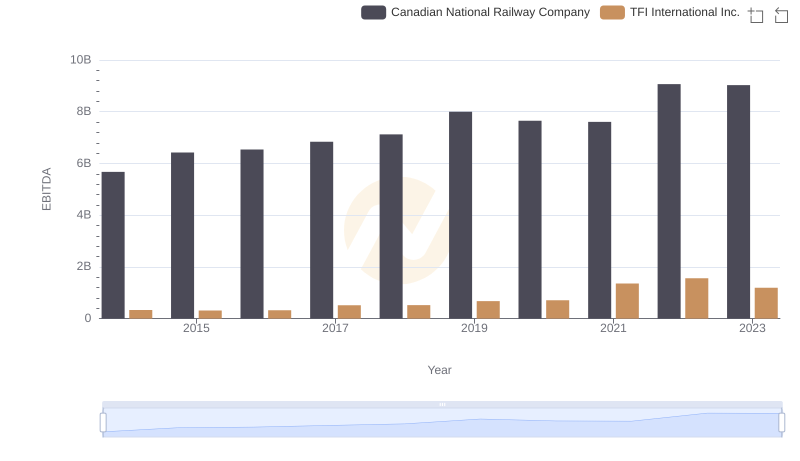
Comprehensive EBITDA Comparison: Canadian National Railway Company vs TFI International Inc.

A Professional Review of EBITDA: Canadian National Railway Company Compared to Rentokil Initial plc
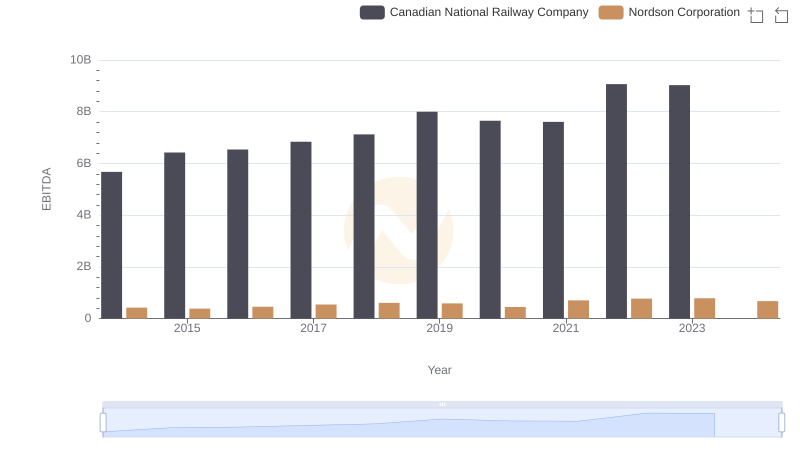
EBITDA Analysis: Evaluating Canadian National Railway Company Against Nordson Corporation
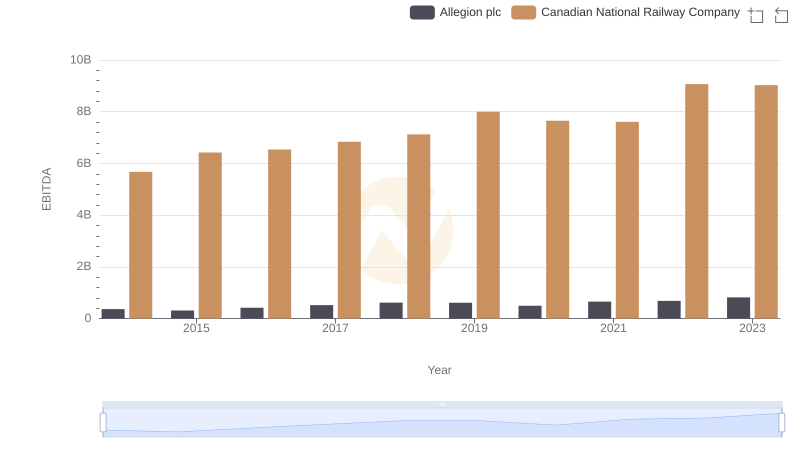
A Side-by-Side Analysis of EBITDA: Canadian National Railway Company and Allegion plc
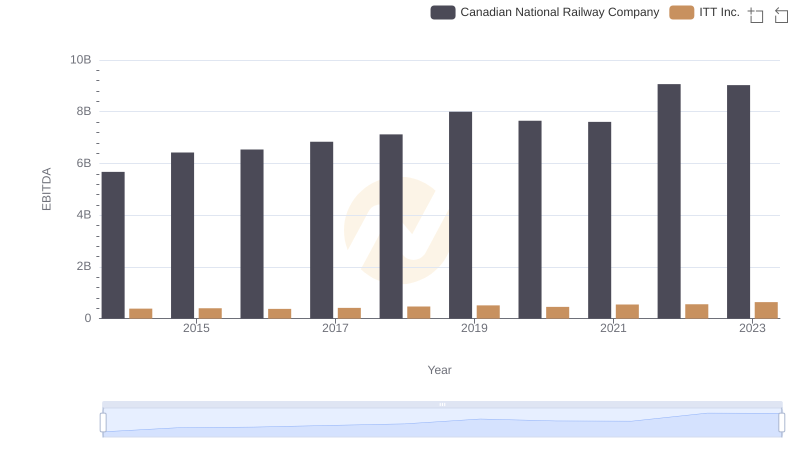
Professional EBITDA Benchmarking: Canadian National Railway Company vs ITT Inc.