| __timestamp | Canadian National Railway Company | Nordson Corporation |
|---|---|---|
| Wednesday, January 1, 2014 | 5674000000 | 427302000 |
| Thursday, January 1, 2015 | 6424000000 | 384160000 |
| Friday, January 1, 2016 | 6537000000 | 460120000 |
| Sunday, January 1, 2017 | 6839000000 | 547746000 |
| Monday, January 1, 2018 | 7124000000 | 606502000 |
| Tuesday, January 1, 2019 | 7999000000 | 588493000 |
| Wednesday, January 1, 2020 | 7652000000 | 446951000 |
| Friday, January 1, 2021 | 7607000000 | 703550000 |
| Saturday, January 1, 2022 | 9067000000 | 771615000 |
| Sunday, January 1, 2023 | 9027000000 | 786742000 |
| Monday, January 1, 2024 | 674001000 |
Unlocking the unknown
In the world of finance, EBITDA (Earnings Before Interest, Taxes, Depreciation, and Amortization) serves as a crucial indicator of a company's operational performance. This analysis pits two industry giants against each other: Canadian National Railway Company and Nordson Corporation, from 2014 to 2023.
Canadian National Railway consistently outperformed Nordson Corporation, with an average EBITDA nearly 13 times higher. Notably, Canadian National Railway's EBITDA peaked in 2022, showing a robust 60% increase from 2014. In contrast, Nordson Corporation's EBITDA grew by approximately 84% over the same period, reflecting steady growth despite its smaller scale.
The data reveals a missing value for Canadian National Railway in 2024, highlighting the importance of complete datasets for accurate analysis. This comparison underscores the diverse financial landscapes of these companies, offering valuable insights for investors and analysts alike.
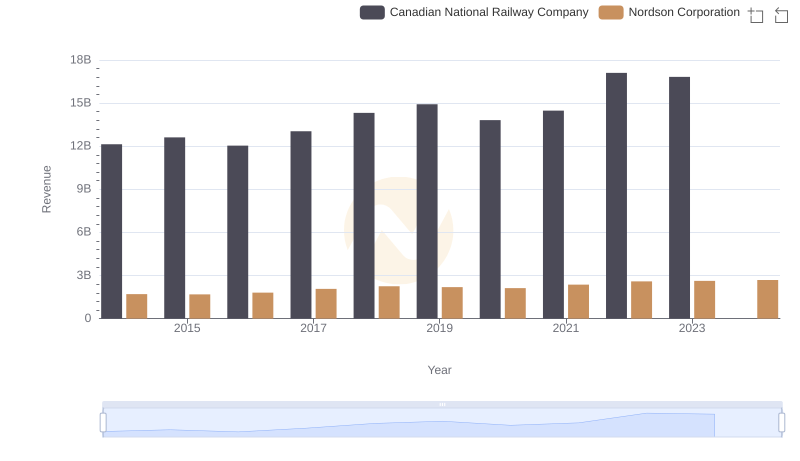
Annual Revenue Comparison: Canadian National Railway Company vs Nordson Corporation
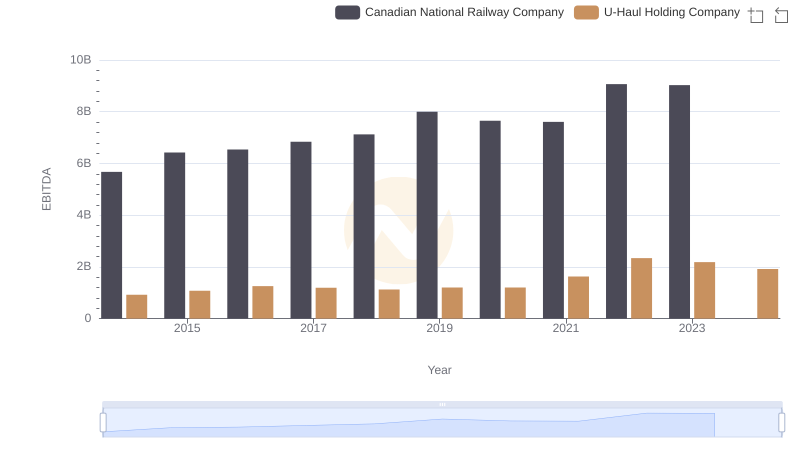
EBITDA Analysis: Evaluating Canadian National Railway Company Against U-Haul Holding Company

EBITDA Analysis: Evaluating Canadian National Railway Company Against Elbit Systems Ltd.
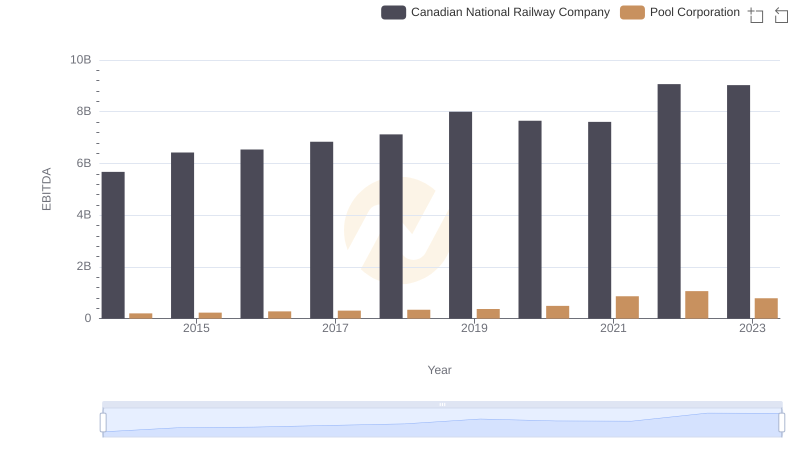
Professional EBITDA Benchmarking: Canadian National Railway Company vs Pool Corporation
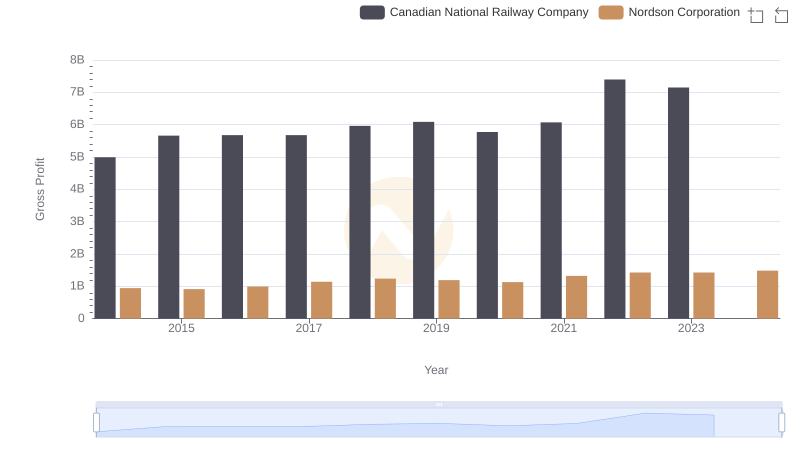
Gross Profit Comparison: Canadian National Railway Company and Nordson Corporation Trends
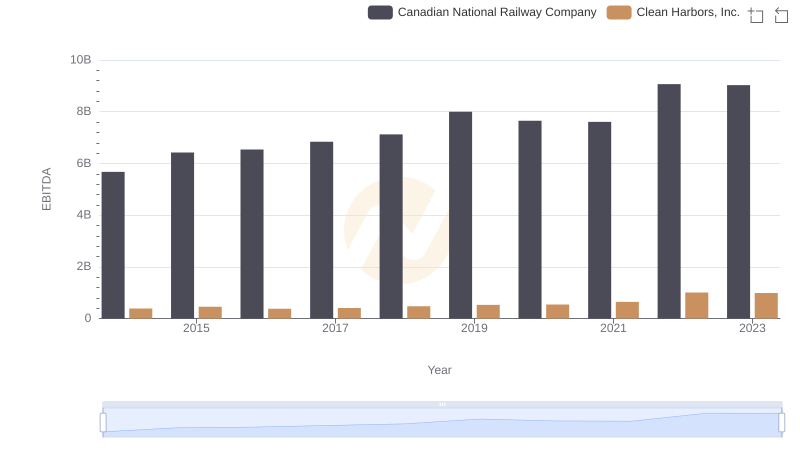
A Professional Review of EBITDA: Canadian National Railway Company Compared to Clean Harbors, Inc.
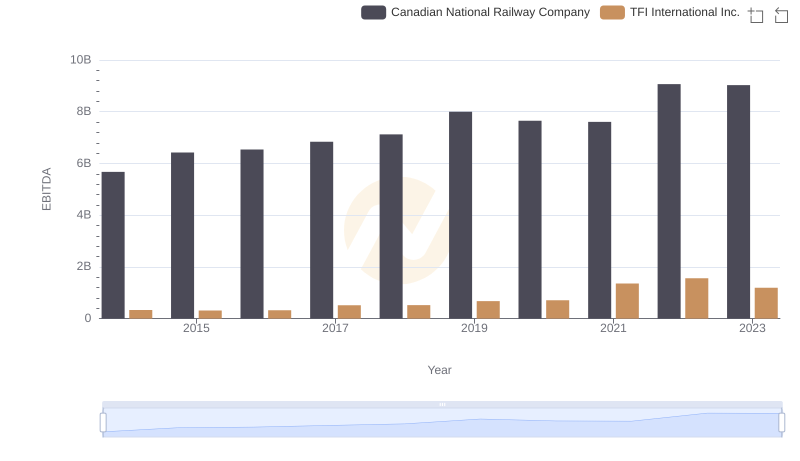
Comprehensive EBITDA Comparison: Canadian National Railway Company vs TFI International Inc.

A Professional Review of EBITDA: Canadian National Railway Company Compared to Rentokil Initial plc
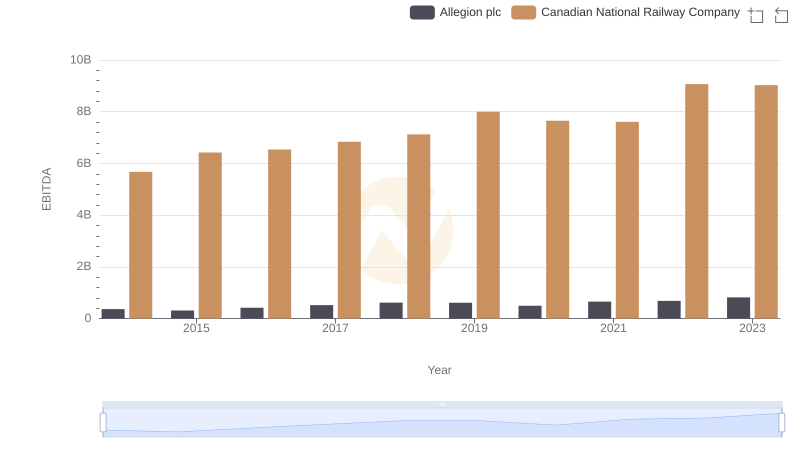
A Side-by-Side Analysis of EBITDA: Canadian National Railway Company and Allegion plc
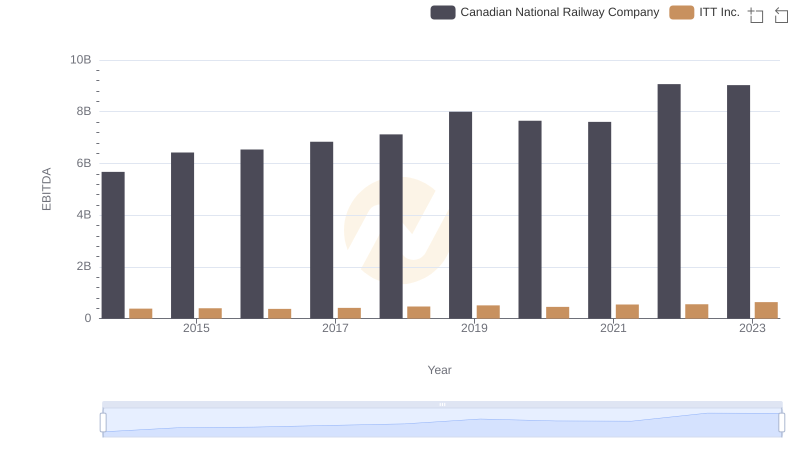
Professional EBITDA Benchmarking: Canadian National Railway Company vs ITT Inc.