| __timestamp | Canadian National Railway Company | Clean Harbors, Inc. |
|---|---|---|
| Wednesday, January 1, 2014 | 4992000000 | 959840000 |
| Thursday, January 1, 2015 | 5660000000 | 918331000 |
| Friday, January 1, 2016 | 5675000000 | 822369000 |
| Sunday, January 1, 2017 | 5675000000 | 882305000 |
| Monday, January 1, 2018 | 5962000000 | 994752000 |
| Tuesday, January 1, 2019 | 6085000000 | 1024371000 |
| Wednesday, January 1, 2020 | 5771000000 | 1006346000 |
| Friday, January 1, 2021 | 6069000000 | 1195729000 |
| Saturday, January 1, 2022 | 7396000000 | 1622675000 |
| Sunday, January 1, 2023 | 7151000000 | 1663028000 |
| Monday, January 1, 2024 | 1824239000 |
Data in motion
In the ever-evolving landscape of North American industries, the financial performance of key players like Canadian National Railway Company and Clean Harbors, Inc. offers a fascinating glimpse into their economic trajectories. From 2014 to 2023, Canadian National Railway consistently outperformed Clean Harbors in gross profit, with an average of approximately 6 billion USD annually, compared to Clean Harbors' 1.1 billion USD. Notably, Canadian National Railway's gross profit surged by nearly 48% from 2014 to 2022, peaking in 2022. Meanwhile, Clean Harbors experienced a steady growth of around 73% over the same period, reflecting its resilience and strategic market positioning. The data highlights the robust growth of these companies, with Canadian National Railway maintaining a dominant position, while Clean Harbors shows promising upward momentum. This comparison underscores the dynamic nature of the transportation and environmental services sectors in North America.

Gross Profit Comparison: Canadian National Railway Company and Saia, Inc. Trends
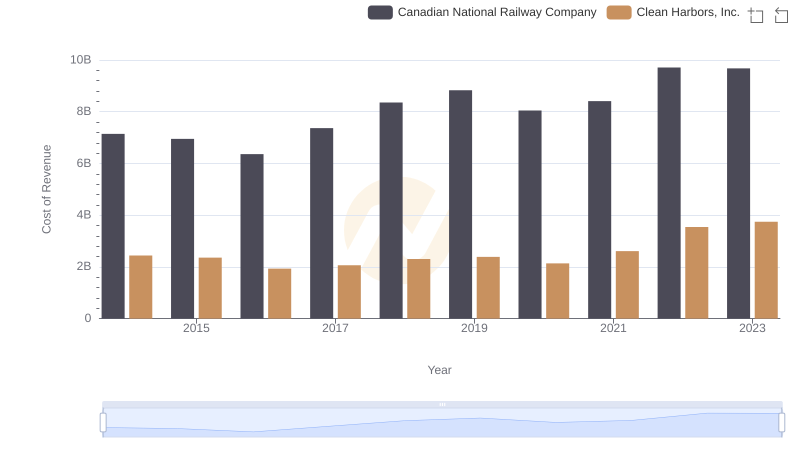
Analyzing Cost of Revenue: Canadian National Railway Company and Clean Harbors, Inc.
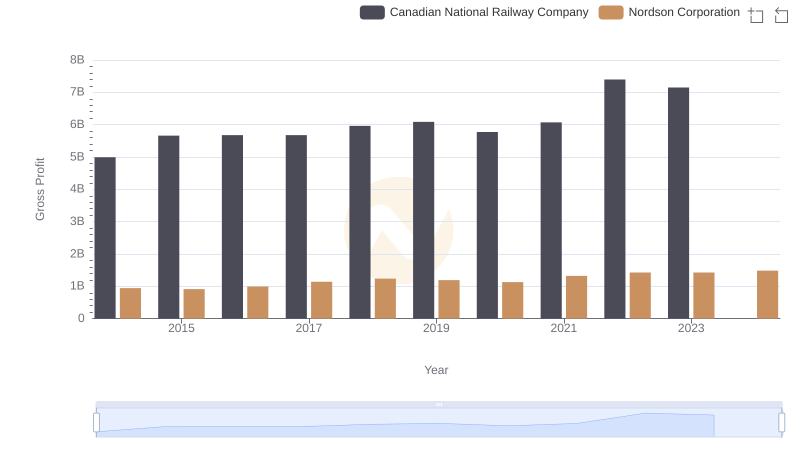
Gross Profit Comparison: Canadian National Railway Company and Nordson Corporation Trends
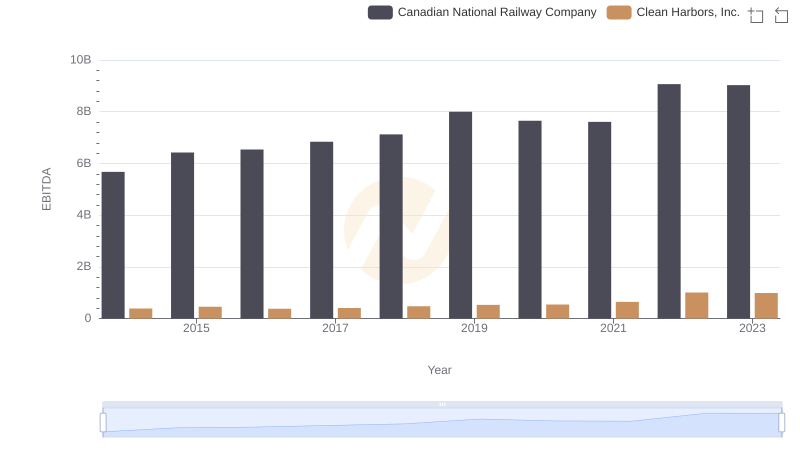
A Professional Review of EBITDA: Canadian National Railway Company Compared to Clean Harbors, Inc.

Gross Profit Trends Compared: Canadian National Railway Company vs Allegion plc