| __timestamp | Canadian National Railway Company | Clean Harbors, Inc. |
|---|---|---|
| Wednesday, January 1, 2014 | 7142000000 | 2441796000 |
| Thursday, January 1, 2015 | 6951000000 | 2356806000 |
| Friday, January 1, 2016 | 6362000000 | 1932857000 |
| Sunday, January 1, 2017 | 7366000000 | 2062673000 |
| Monday, January 1, 2018 | 8359000000 | 2305551000 |
| Tuesday, January 1, 2019 | 8832000000 | 2387819000 |
| Wednesday, January 1, 2020 | 8048000000 | 2137751000 |
| Friday, January 1, 2021 | 8408000000 | 2609837000 |
| Saturday, January 1, 2022 | 9711000000 | 3543930000 |
| Sunday, January 1, 2023 | 9677000000 | 3746124000 |
| Monday, January 1, 2024 | 4065713000 |
Cracking the code
In the world of transportation and environmental services, Canadian National Railway Company and Clean Harbors, Inc. stand as giants. Over the past decade, from 2014 to 2023, these companies have shown distinct trends in their cost of revenue. Canadian National Railway Company, a leader in rail transport, has seen its cost of revenue grow by approximately 36%, peaking in 2022. This reflects the company's strategic investments and operational expansions. Meanwhile, Clean Harbors, Inc., a key player in environmental services, has experienced a remarkable 54% increase in cost of revenue, highlighting its aggressive growth and adaptation to increasing environmental regulations. The data reveals a fascinating narrative of industry dynamics, where both companies navigate their unique challenges and opportunities. As we delve deeper into these trends, it becomes evident that understanding cost structures is crucial for stakeholders aiming to make informed decisions in these sectors.

Cost of Revenue Trends: Canadian National Railway Company vs AECOM
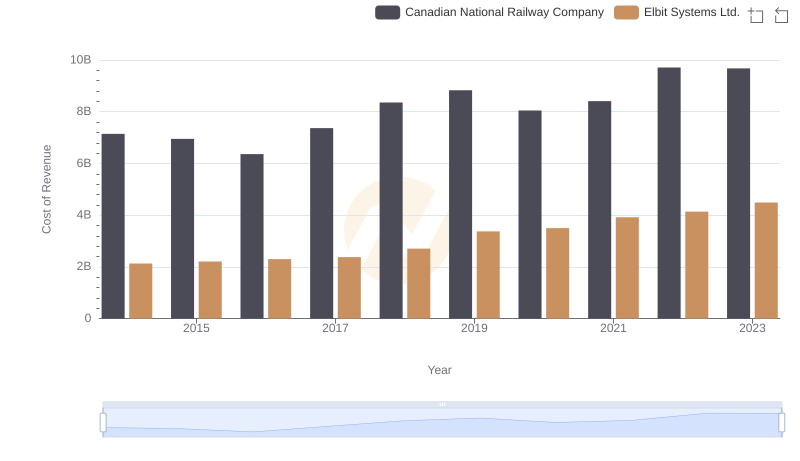
Analyzing Cost of Revenue: Canadian National Railway Company and Elbit Systems Ltd.
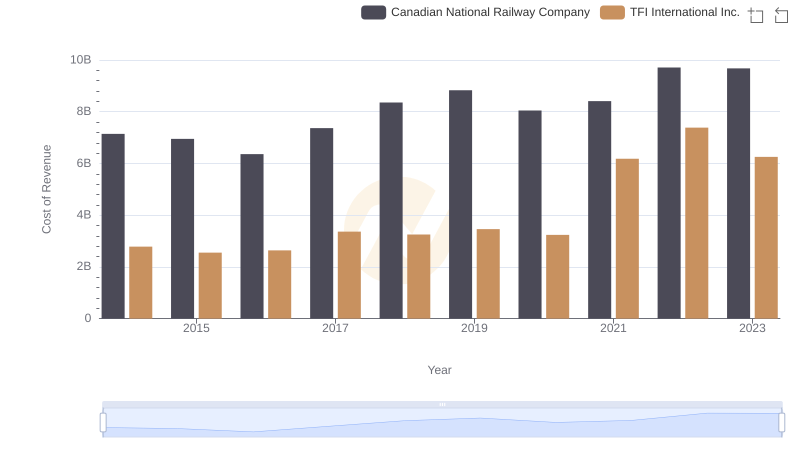
Comparing Cost of Revenue Efficiency: Canadian National Railway Company vs TFI International Inc.
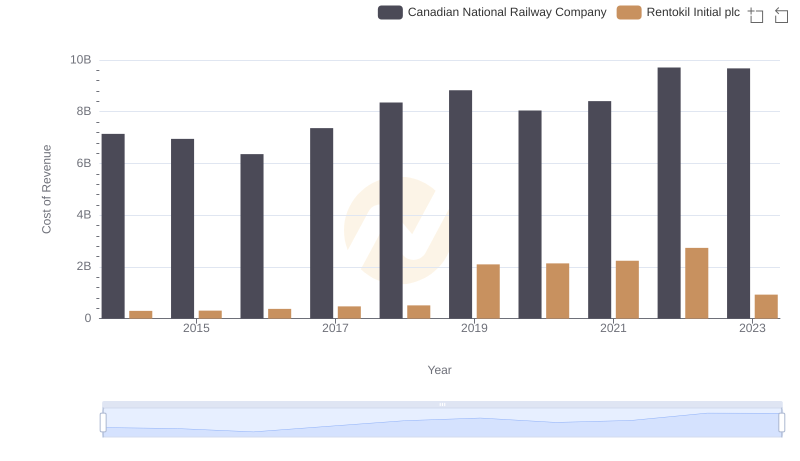
Canadian National Railway Company vs Rentokil Initial plc: Efficiency in Cost of Revenue Explored

Gross Profit Comparison: Canadian National Railway Company and Clean Harbors, Inc. Trends
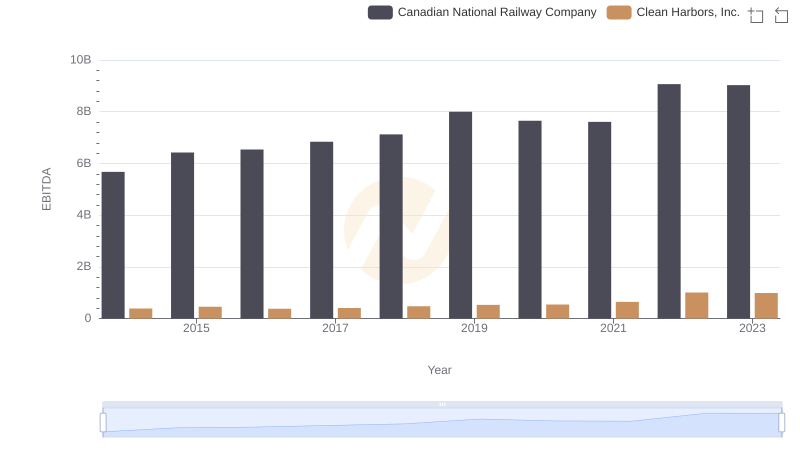
A Professional Review of EBITDA: Canadian National Railway Company Compared to Clean Harbors, Inc.