| __timestamp | AMETEK, Inc. | Dover Corporation |
|---|---|---|
| Wednesday, January 1, 2014 | 4021964000 | 7752728000 |
| Thursday, January 1, 2015 | 3974295000 | 6956311000 |
| Friday, January 1, 2016 | 3840087000 | 6794342000 |
| Sunday, January 1, 2017 | 4300170000 | 7830436000 |
| Monday, January 1, 2018 | 4845872000 | 6992118000 |
| Tuesday, January 1, 2019 | 5158557000 | 7136397000 |
| Wednesday, January 1, 2020 | 4540029000 | 6683760000 |
| Friday, January 1, 2021 | 5546514000 | 7907081000 |
| Saturday, January 1, 2022 | 6150530000 | 8508088000 |
| Sunday, January 1, 2023 | 6596950000 | 8438134000 |
| Monday, January 1, 2024 | 6941180000 | 7745909000 |
In pursuit of knowledge
In the competitive landscape of industrial manufacturing, AMETEK, Inc. and Dover Corporation have been pivotal players. Over the past decade, these companies have showcased remarkable resilience and growth. From 2014 to 2023, AMETEK's revenue surged by approximately 64%, while Dover Corporation experienced a more modest increase of around 9%. This growth trajectory highlights AMETEK's strategic advancements in the industry.
AMETEK's revenue growth is particularly impressive, with a consistent upward trend, peaking in 2023. Dover, while maintaining a steady revenue stream, saw fluctuations, notably in 2016 and 2020. These variations could be attributed to market dynamics and strategic shifts within the company. As we look to the future, both companies are poised to leverage their strengths, with AMETEK focusing on innovation and Dover on diversification.
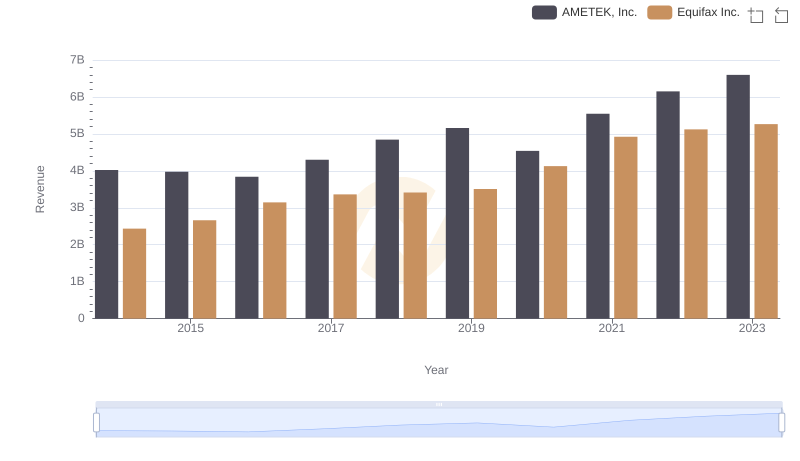
AMETEK, Inc. or Equifax Inc.: Who Leads in Yearly Revenue?
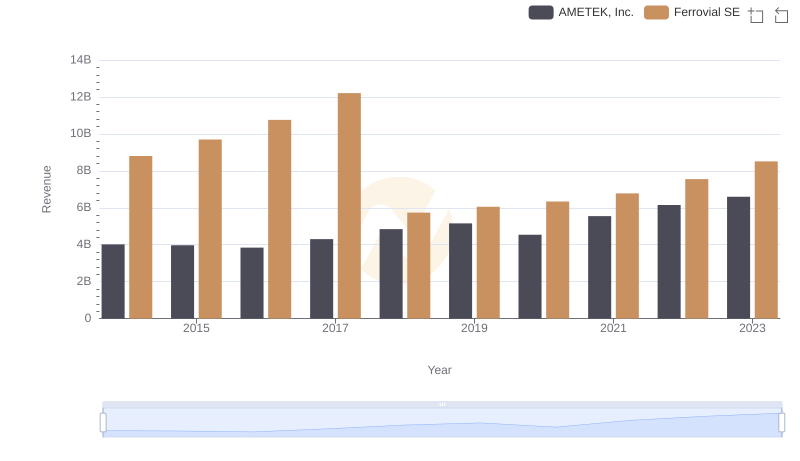
AMETEK, Inc. or Ferrovial SE: Who Leads in Yearly Revenue?
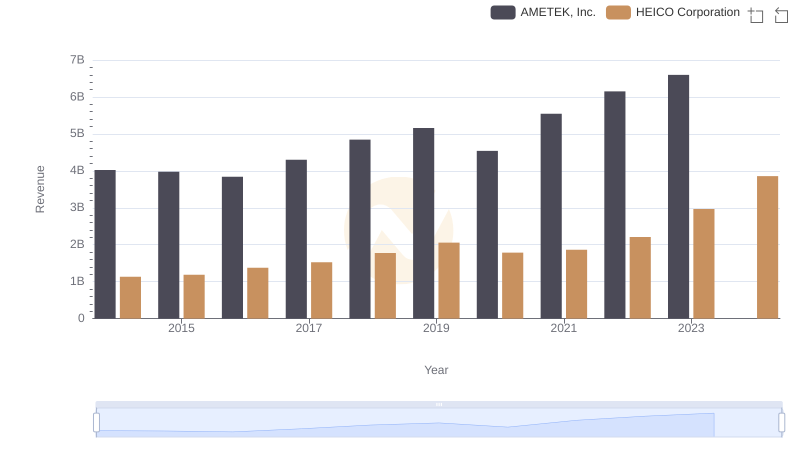
AMETEK, Inc. and HEICO Corporation: A Comprehensive Revenue Analysis
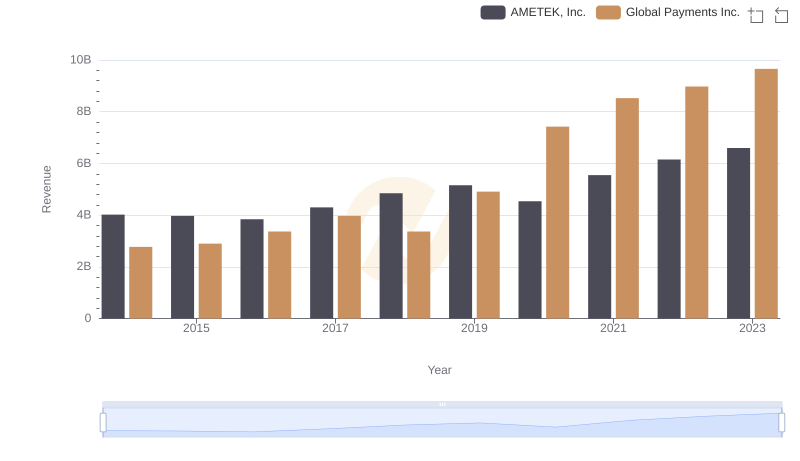
AMETEK, Inc. or Global Payments Inc.: Who Leads in Yearly Revenue?
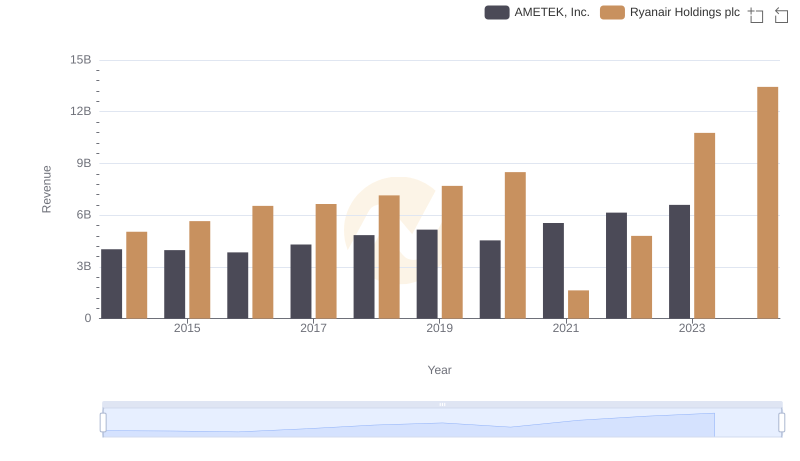
AMETEK, Inc. vs Ryanair Holdings plc: Examining Key Revenue Metrics
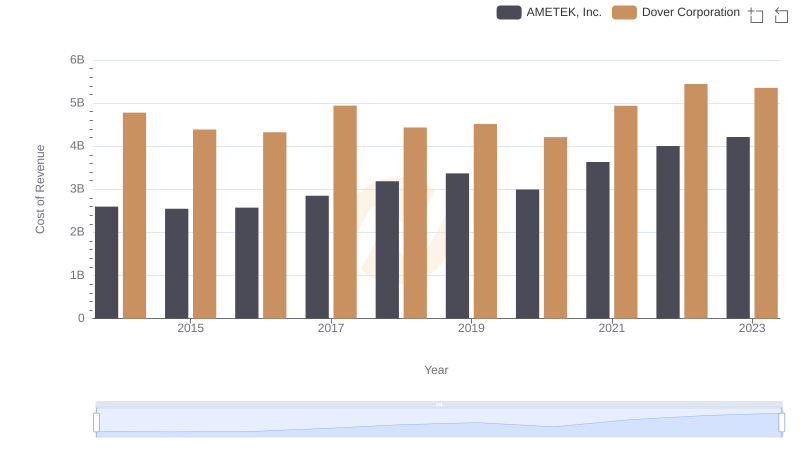
Cost of Revenue: Key Insights for AMETEK, Inc. and Dover Corporation
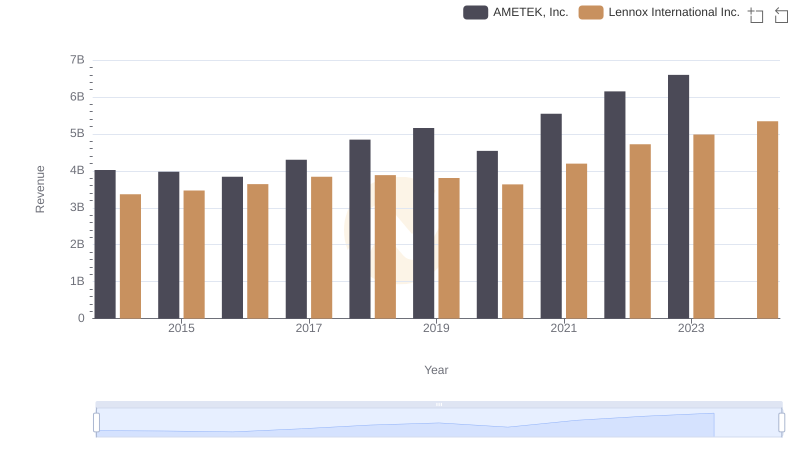
Annual Revenue Comparison: AMETEK, Inc. vs Lennox International Inc.
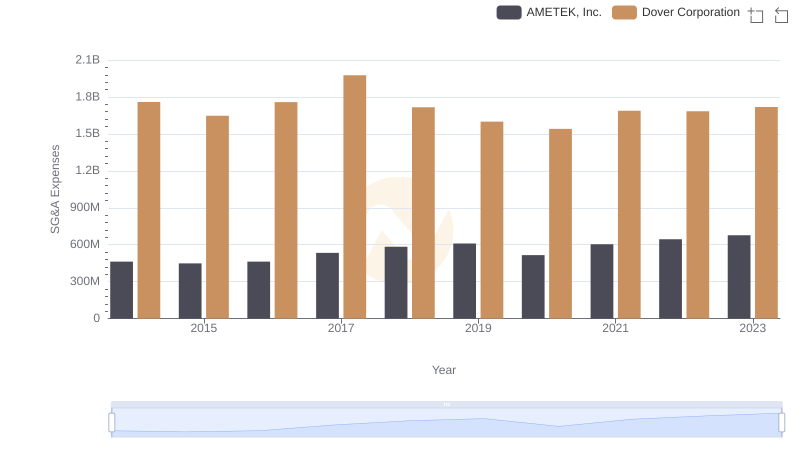
AMETEK, Inc. or Dover Corporation: Who Manages SG&A Costs Better?
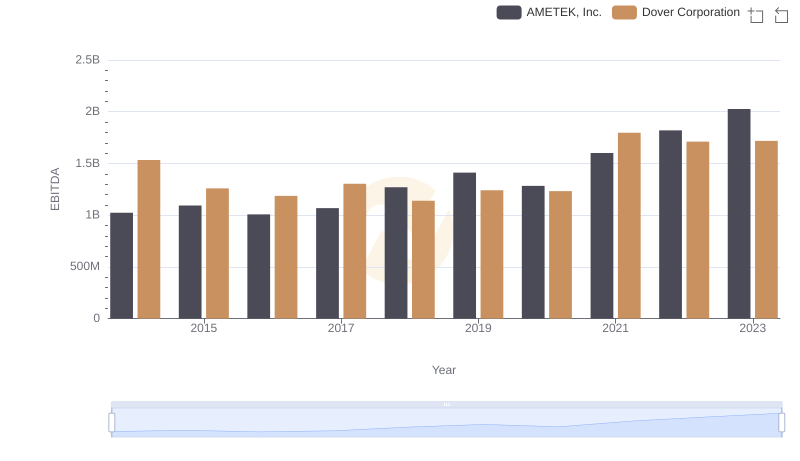
A Professional Review of EBITDA: AMETEK, Inc. Compared to Dover Corporation