| __timestamp | 3M Company | United Airlines Holdings, Inc. |
|---|---|---|
| Wednesday, January 1, 2014 | 6469000000 | 1373000000 |
| Thursday, January 1, 2015 | 6182000000 | 1342000000 |
| Friday, January 1, 2016 | 6111000000 | 1303000000 |
| Sunday, January 1, 2017 | 6572000000 | 1349000000 |
| Monday, January 1, 2018 | 7602000000 | 1558000000 |
| Tuesday, January 1, 2019 | 7029000000 | 1651000000 |
| Wednesday, January 1, 2020 | 6929000000 | 459000000 |
| Friday, January 1, 2021 | 7197000000 | 677000000 |
| Saturday, January 1, 2022 | 9049000000 | 1535000000 |
| Sunday, January 1, 2023 | 21526000000 | 1977000000 |
| Monday, January 1, 2024 | 4221000000 | 2231000000 |
In pursuit of knowledge
In the ever-evolving landscape of corporate finance, understanding the trends in Selling, General, and Administrative (SG&A) expenses is crucial for investors and analysts alike. Over the past decade, 3M Company and United Airlines Holdings, Inc. have showcased contrasting trajectories in their SG&A expenses.
From 2014 to 2023, 3M's SG&A expenses have seen a significant increase, peaking in 2023 with a staggering 166% rise compared to 2014. This upward trend reflects 3M's strategic investments in innovation and market expansion. In contrast, United Airlines experienced a more volatile pattern, with a notable dip in 2020, likely due to the pandemic's impact on the airline industry. However, by 2023, United Airlines managed to recover, showing a 44% increase from its 2020 low.
These insights highlight the dynamic nature of SG&A expenses and their implications for corporate strategy and financial health.
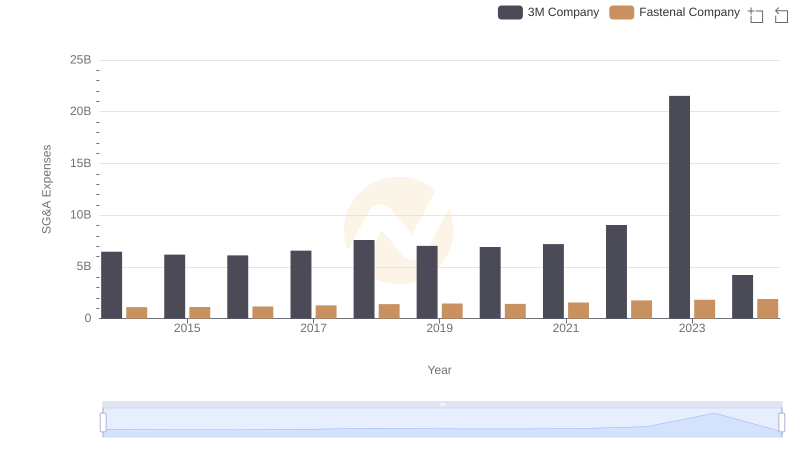
Breaking Down SG&A Expenses: 3M Company vs Fastenal Company
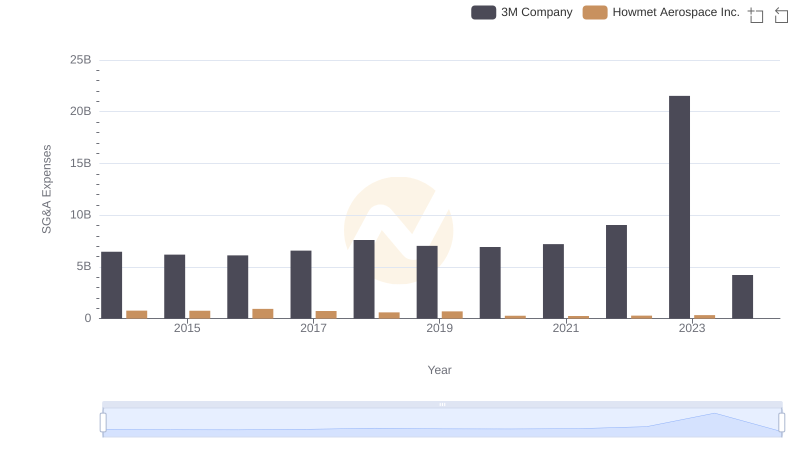
Who Optimizes SG&A Costs Better? 3M Company or Howmet Aerospace Inc.
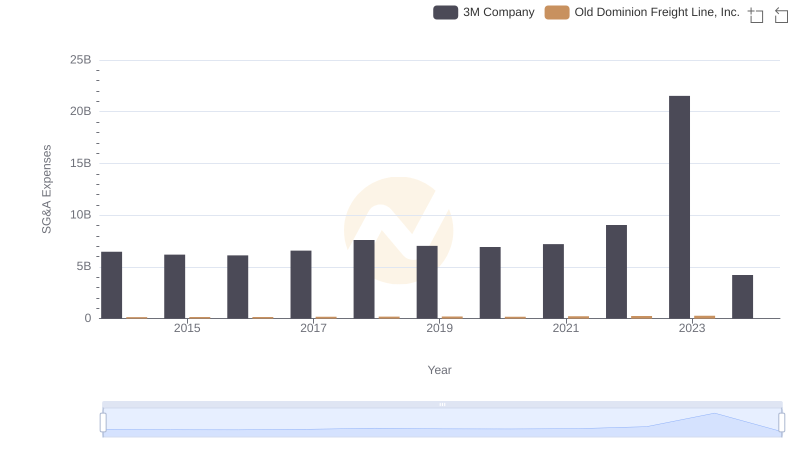
Who Optimizes SG&A Costs Better? 3M Company or Old Dominion Freight Line, Inc.
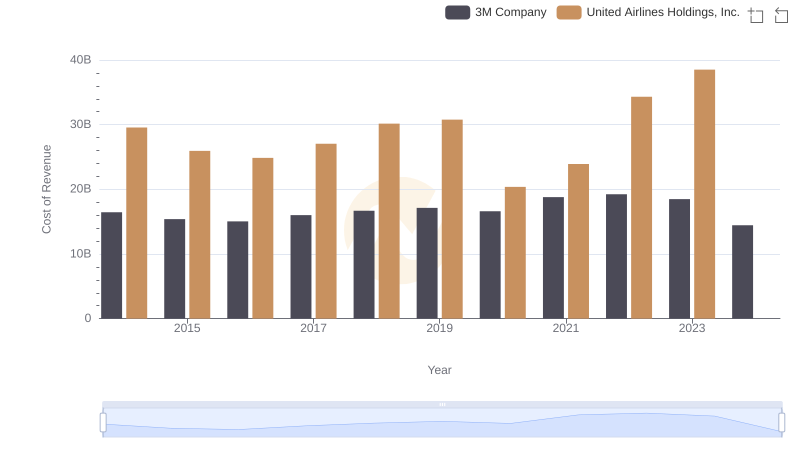
Cost Insights: Breaking Down 3M Company and United Airlines Holdings, Inc.'s Expenses

Operational Costs Compared: SG&A Analysis of 3M Company and Axon Enterprise, Inc.
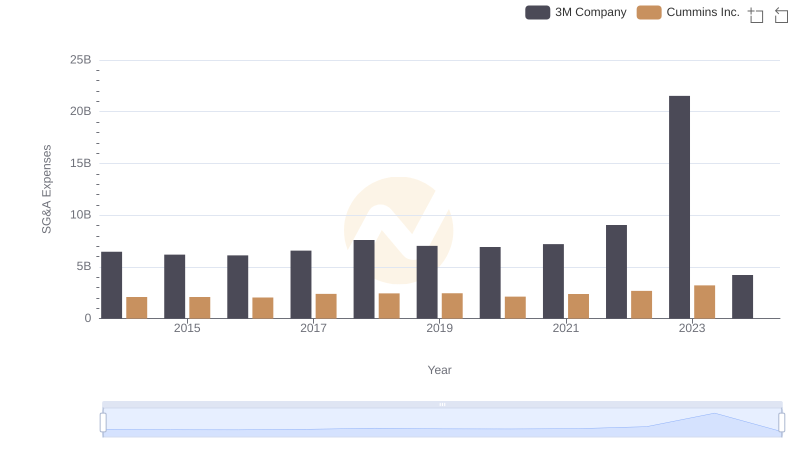
3M Company or Cummins Inc.: Who Manages SG&A Costs Better?

Selling, General, and Administrative Costs: 3M Company vs Verisk Analytics, Inc.
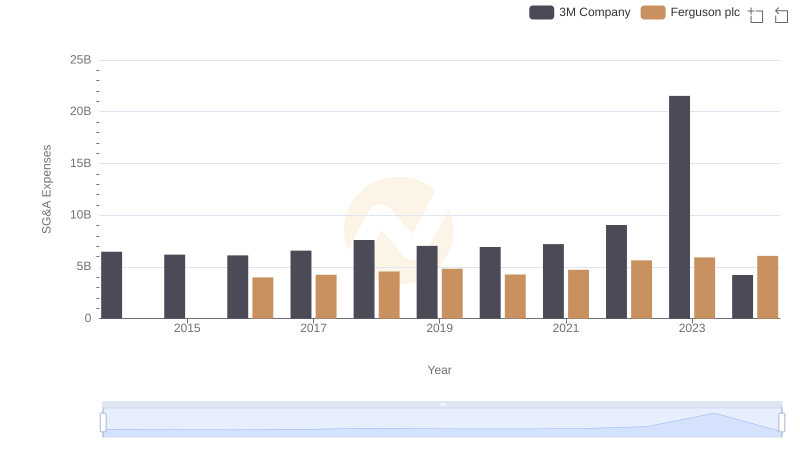
3M Company or Ferguson plc: Who Manages SG&A Costs Better?
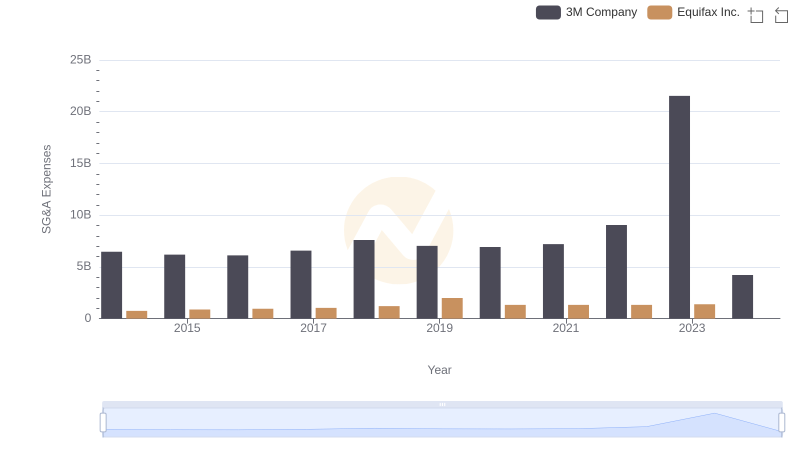
Comparing SG&A Expenses: 3M Company vs Equifax Inc. Trends and Insights

Breaking Down SG&A Expenses: 3M Company vs Ryanair Holdings plc