| __timestamp | 3M Company | Axon Enterprise, Inc. |
|---|---|---|
| Wednesday, January 1, 2014 | 6469000000 | 54158000 |
| Thursday, January 1, 2015 | 6182000000 | 69698000 |
| Friday, January 1, 2016 | 6111000000 | 108076000 |
| Sunday, January 1, 2017 | 6572000000 | 138692000 |
| Monday, January 1, 2018 | 7602000000 | 156886000 |
| Tuesday, January 1, 2019 | 7029000000 | 212959000 |
| Wednesday, January 1, 2020 | 6929000000 | 307286000 |
| Friday, January 1, 2021 | 7197000000 | 515007000 |
| Saturday, January 1, 2022 | 9049000000 | 401575000 |
| Sunday, January 1, 2023 | 21526000000 | 496874000 |
| Monday, January 1, 2024 | 4221000000 |
Unveiling the hidden dimensions of data
In the world of corporate finance, understanding operational costs is crucial for evaluating a company's efficiency. This analysis compares the Selling, General, and Administrative (SG&A) expenses of two industry giants: 3M Company and Axon Enterprise, Inc., from 2014 to 2023.
3M's SG&A expenses have shown a significant upward trend, peaking in 2023 with a staggering 166% increase from 2014. This rise reflects 3M's expansive operational strategies and market adaptation over the years.
Axon, on the other hand, has experienced a remarkable growth trajectory, with SG&A expenses increasing by over 800% from 2014 to 2023. This surge underscores Axon's aggressive expansion and investment in innovation.
Note: The data for 2024 is incomplete, highlighting the dynamic nature of financial reporting.
This comparative analysis offers a window into the strategic financial maneuvers of these two companies, providing valuable insights for investors and analysts alike.
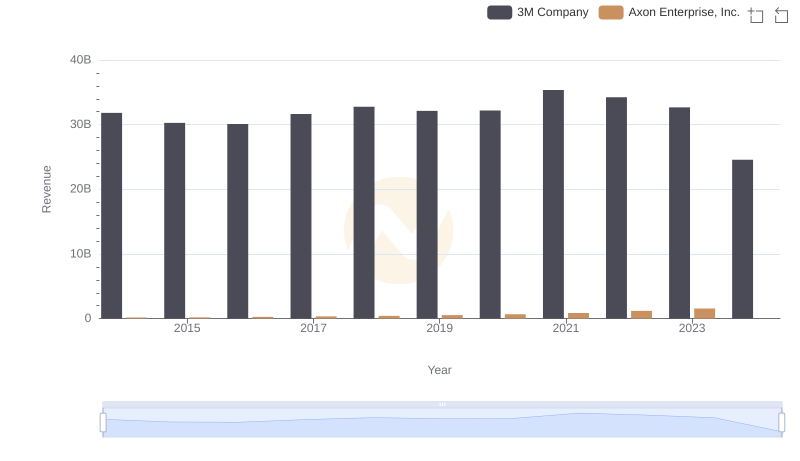
Revenue Showdown: 3M Company vs Axon Enterprise, Inc.
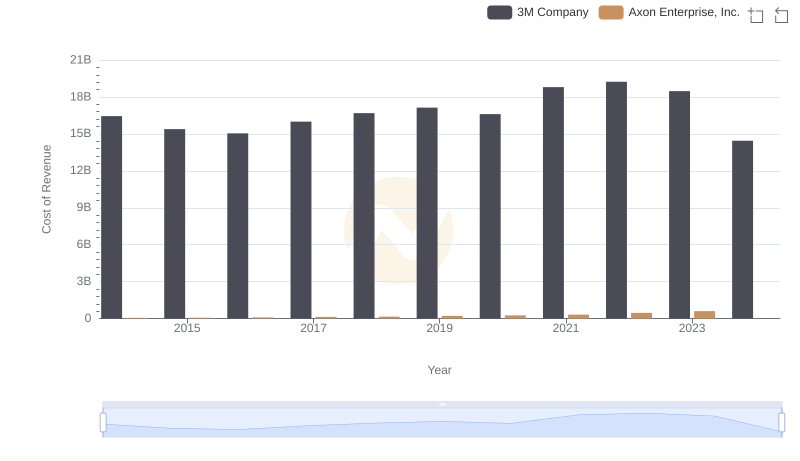
Cost of Revenue Trends: 3M Company vs Axon Enterprise, Inc.
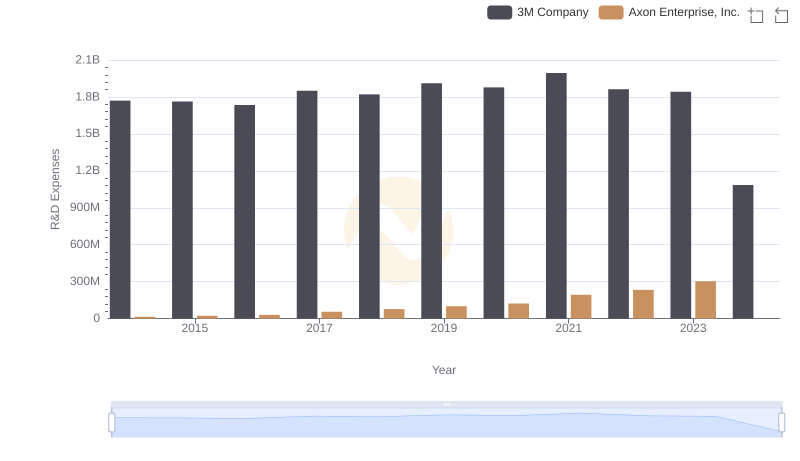
3M Company or Axon Enterprise, Inc.: Who Invests More in Innovation?
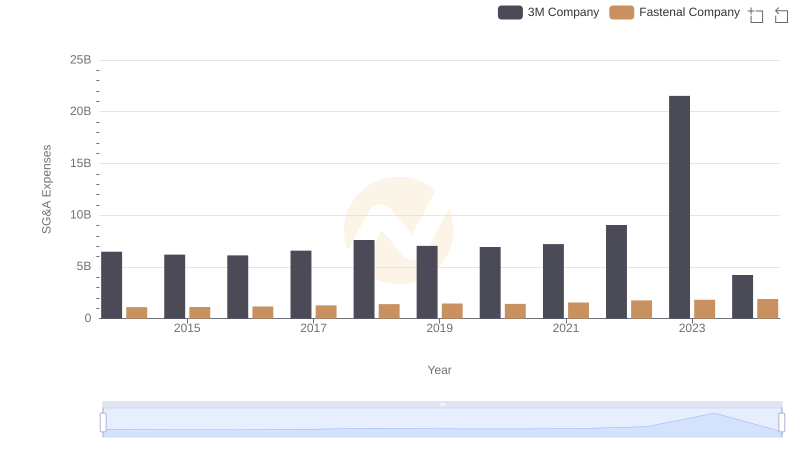
Breaking Down SG&A Expenses: 3M Company vs Fastenal Company
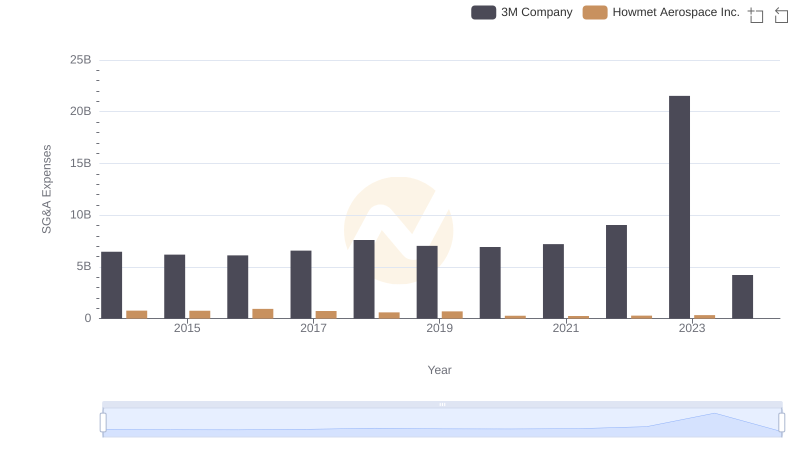
Who Optimizes SG&A Costs Better? 3M Company or Howmet Aerospace Inc.
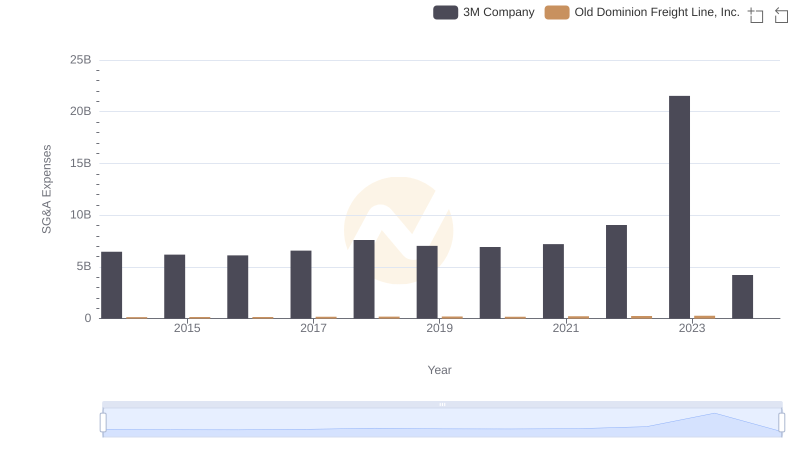
Who Optimizes SG&A Costs Better? 3M Company or Old Dominion Freight Line, Inc.
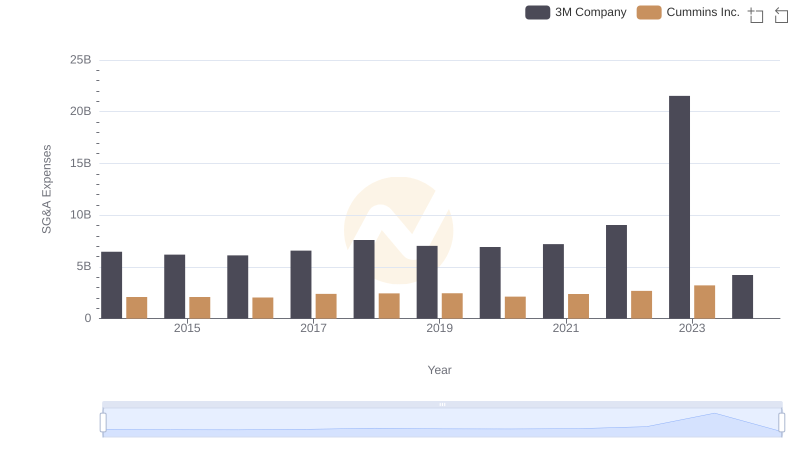
3M Company or Cummins Inc.: Who Manages SG&A Costs Better?

3M Company vs United Airlines Holdings, Inc.: SG&A Expense Trends