| __timestamp | 3M Company | Fastenal Company |
|---|---|---|
| Wednesday, January 1, 2014 | 6469000000 | 1110776000 |
| Thursday, January 1, 2015 | 6182000000 | 1121590000 |
| Friday, January 1, 2016 | 6111000000 | 1169470000 |
| Sunday, January 1, 2017 | 6572000000 | 1282800000 |
| Monday, January 1, 2018 | 7602000000 | 1400200000 |
| Tuesday, January 1, 2019 | 7029000000 | 1459400000 |
| Wednesday, January 1, 2020 | 6929000000 | 1427400000 |
| Friday, January 1, 2021 | 7197000000 | 1559800000 |
| Saturday, January 1, 2022 | 9049000000 | 1762200000 |
| Sunday, January 1, 2023 | 21526000000 | 1825800000 |
| Monday, January 1, 2024 | 4221000000 | 1891900000 |
Unveiling the hidden dimensions of data
In the ever-evolving landscape of corporate finance, understanding the nuances of Selling, General, and Administrative (SG&A) expenses is crucial. Over the past decade, 3M Company and Fastenal Company have showcased distinct trajectories in their SG&A expenditures. From 2014 to 2023, 3M's SG&A expenses have seen a dramatic increase, peaking in 2023 with a staggering 166% rise compared to 2014. In contrast, Fastenal's expenses have grown more steadily, with a 64% increase over the same period. This divergence highlights 3M's aggressive expansion strategies, while Fastenal maintains a more conservative approach. The data from 2024, however, shows a surprising dip for 3M, suggesting potential cost-cutting measures or strategic shifts. As businesses navigate the complexities of the modern market, these insights into SG&A trends offer valuable lessons in financial management and strategic planning.
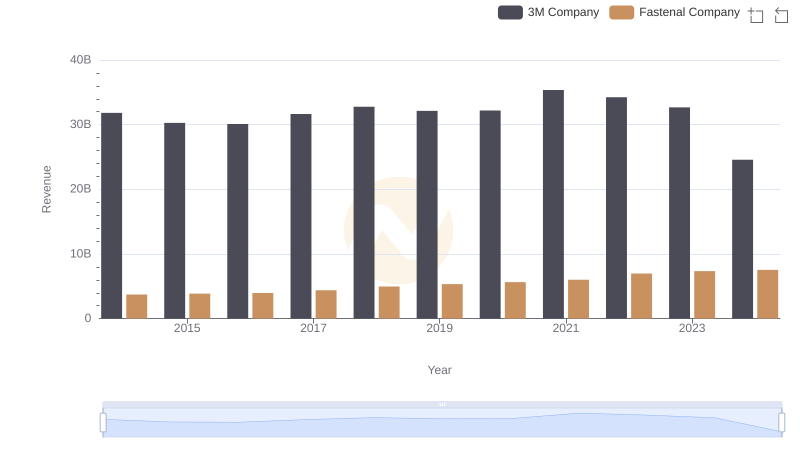
3M Company or Fastenal Company: Who Leads in Yearly Revenue?
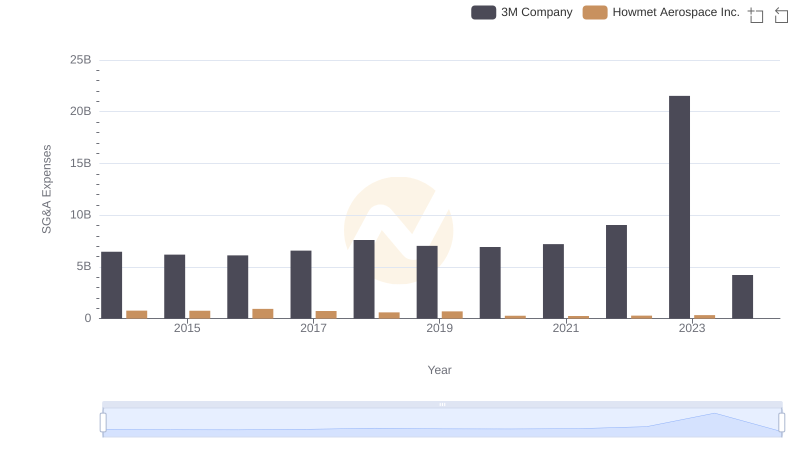
Who Optimizes SG&A Costs Better? 3M Company or Howmet Aerospace Inc.
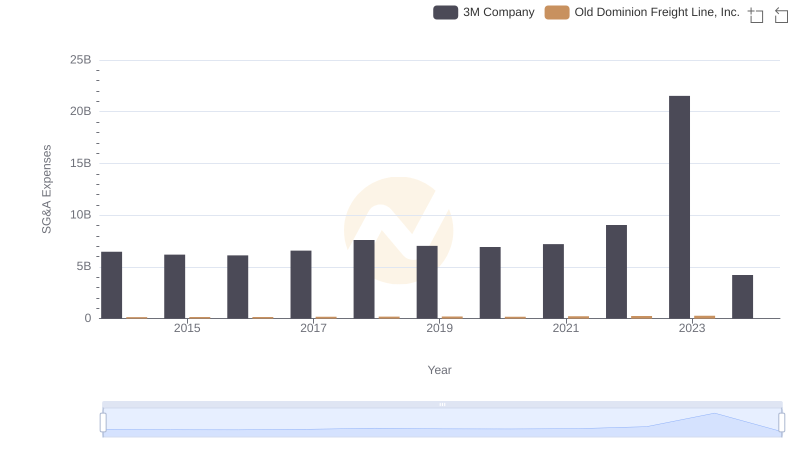
Who Optimizes SG&A Costs Better? 3M Company or Old Dominion Freight Line, Inc.

Operational Costs Compared: SG&A Analysis of 3M Company and Axon Enterprise, Inc.
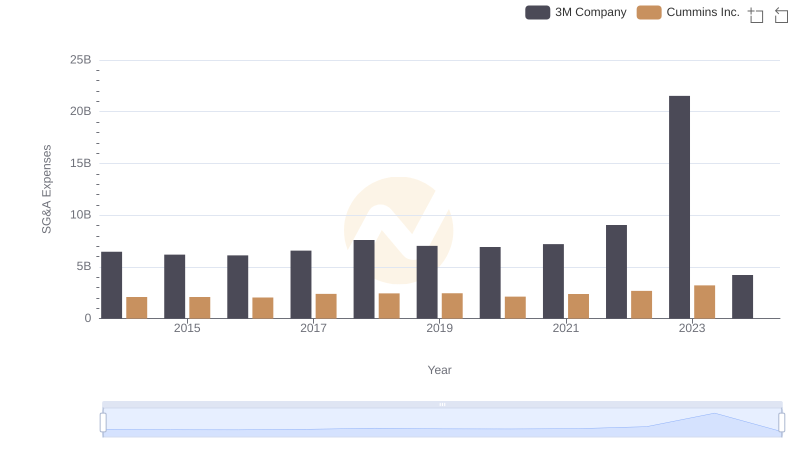
3M Company or Cummins Inc.: Who Manages SG&A Costs Better?

3M Company vs United Airlines Holdings, Inc.: SG&A Expense Trends