| __timestamp | Lennox International Inc. | Westinghouse Air Brake Technologies Corporation |
|---|---|---|
| Wednesday, January 1, 2014 | 387700000 | 588370000 |
| Thursday, January 1, 2015 | 423600000 | 672301000 |
| Friday, January 1, 2016 | 490800000 | 535893000 |
| Sunday, January 1, 2017 | 562900000 | 532795000 |
| Monday, January 1, 2018 | 575200000 | 584199000 |
| Tuesday, January 1, 2019 | 633300000 | 1067300000 |
| Wednesday, January 1, 2020 | 553900000 | 1229400000 |
| Friday, January 1, 2021 | 652500000 | 1405000000 |
| Saturday, January 1, 2022 | 729000000 | 1519000000 |
| Sunday, January 1, 2023 | 879500000 | 1787000000 |
| Monday, January 1, 2024 | 1034800000 | 1609000000 |
Igniting the spark of knowledge
In the competitive landscape of industrial giants, Westinghouse Air Brake Technologies Corporation and Lennox International Inc. have showcased remarkable EBITDA growth over the past decade. From 2014 to 2023, Westinghouse Air Brake Technologies Corporation's EBITDA surged by approximately 204%, peaking in 2023. Meanwhile, Lennox International Inc. demonstrated a steady climb, with a 168% increase, reaching its highest point in 2024.
This data highlights the resilience and strategic prowess of these corporations, setting a benchmark for industry performance. Missing data for 2024 for Westinghouse suggests potential for further analysis.

Westinghouse Air Brake Technologies Corporation vs Lennox International Inc.: Examining Key Revenue Metrics
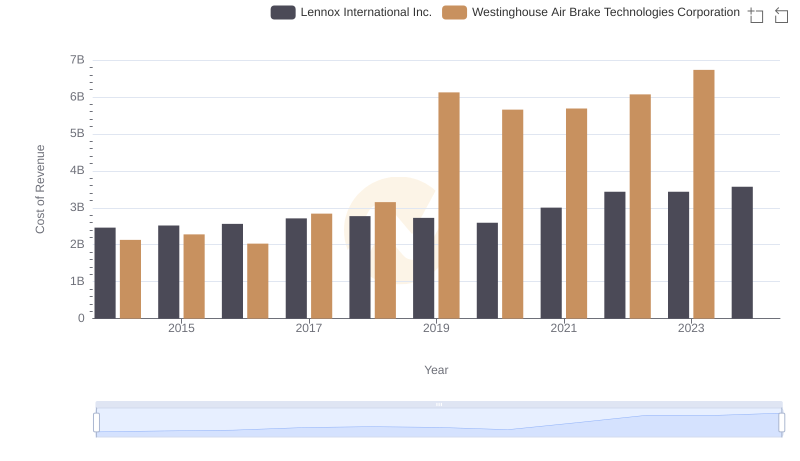
Westinghouse Air Brake Technologies Corporation vs Lennox International Inc.: Efficiency in Cost of Revenue Explored
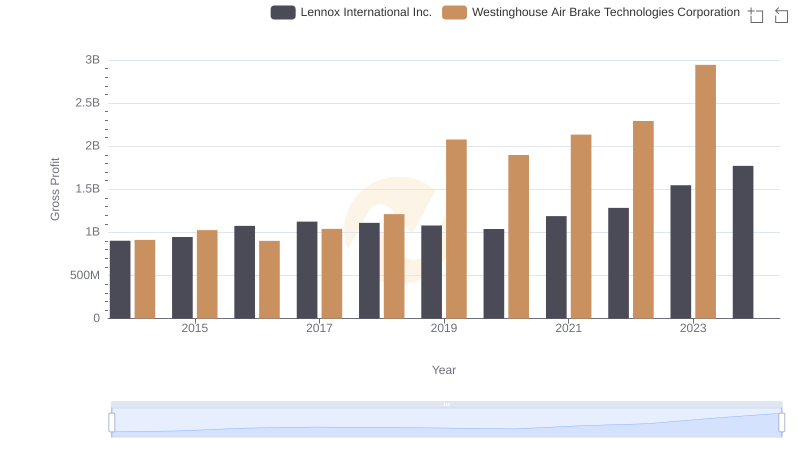
Gross Profit Comparison: Westinghouse Air Brake Technologies Corporation and Lennox International Inc. Trends
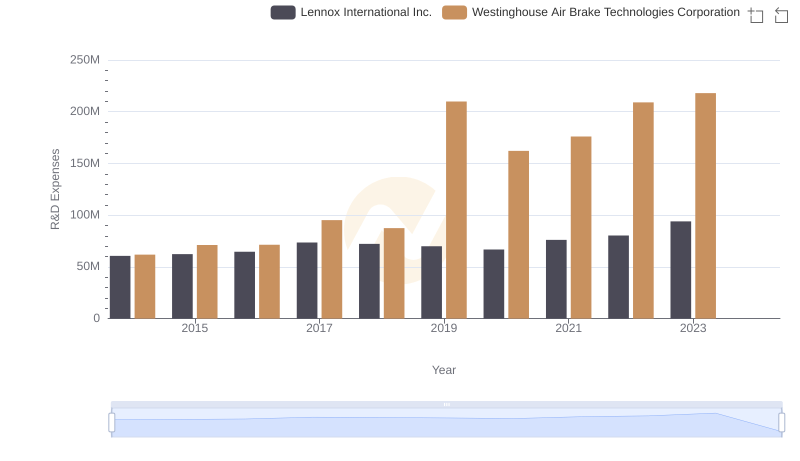
Research and Development Expenses Breakdown: Westinghouse Air Brake Technologies Corporation vs Lennox International Inc.
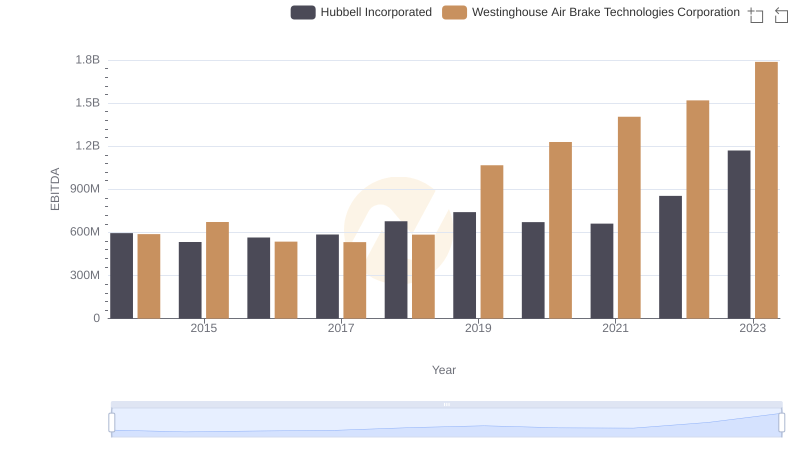
EBITDA Analysis: Evaluating Westinghouse Air Brake Technologies Corporation Against Hubbell Incorporated
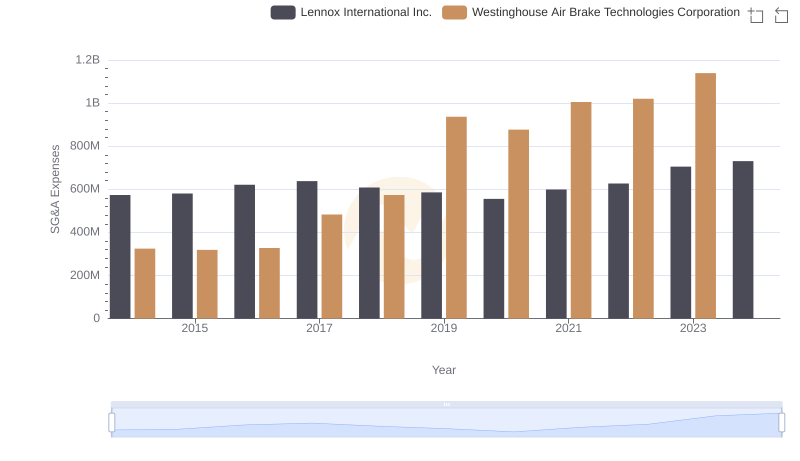
SG&A Efficiency Analysis: Comparing Westinghouse Air Brake Technologies Corporation and Lennox International Inc.
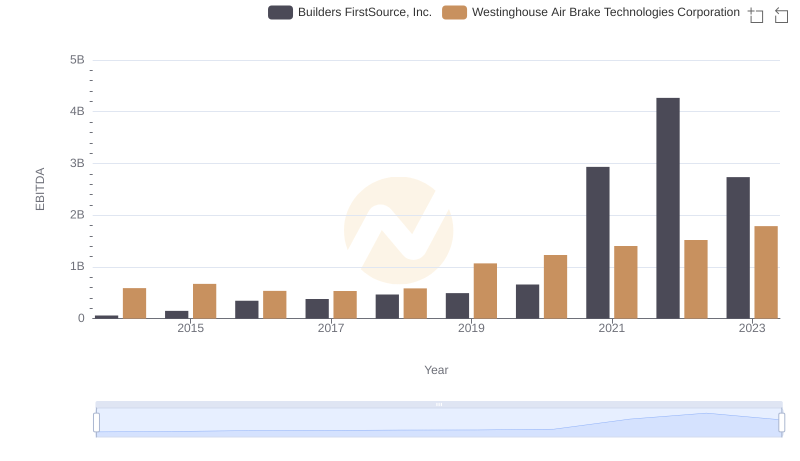
A Side-by-Side Analysis of EBITDA: Westinghouse Air Brake Technologies Corporation and Builders FirstSource, Inc.
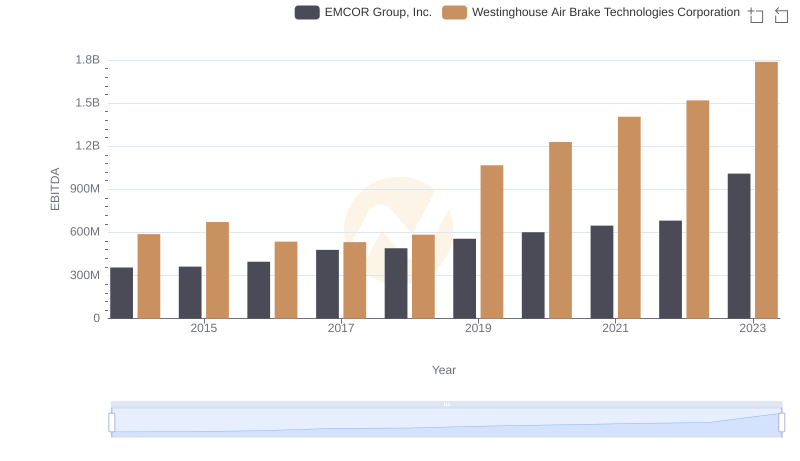
Professional EBITDA Benchmarking: Westinghouse Air Brake Technologies Corporation vs EMCOR Group, Inc.
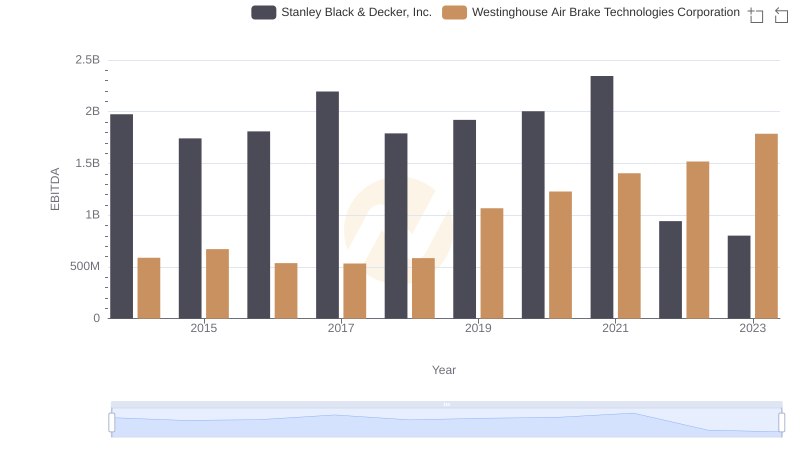
Comparative EBITDA Analysis: Westinghouse Air Brake Technologies Corporation vs Stanley Black & Decker, Inc.