| __timestamp | Builders FirstSource, Inc. | Westinghouse Air Brake Technologies Corporation |
|---|---|---|
| Wednesday, January 1, 2014 | 60008000 | 588370000 |
| Thursday, January 1, 2015 | 148897000 | 672301000 |
| Friday, January 1, 2016 | 346129000 | 535893000 |
| Sunday, January 1, 2017 | 378096000 | 532795000 |
| Monday, January 1, 2018 | 466874000 | 584199000 |
| Tuesday, January 1, 2019 | 492344000 | 1067300000 |
| Wednesday, January 1, 2020 | 660420000 | 1229400000 |
| Friday, January 1, 2021 | 2934776000 | 1405000000 |
| Saturday, January 1, 2022 | 4267346000 | 1519000000 |
| Sunday, January 1, 2023 | 2734594000 | 1787000000 |
| Monday, January 1, 2024 | 1609000000 |
Data in motion
In the ever-evolving landscape of the U.S. stock market, the financial performance of companies is a key indicator of their resilience and adaptability. Over the past decade, Builders FirstSource, Inc. and Westinghouse Air Brake Technologies Corporation have showcased intriguing trends in their EBITDA, a crucial measure of profitability.
From 2014 to 2023, Builders FirstSource, Inc. experienced a staggering growth of over 4,500%, with its EBITDA peaking in 2022. This remarkable rise underscores the company's strategic maneuvers in the construction sector. Meanwhile, Westinghouse Air Brake Technologies Corporation demonstrated a steady increase, with a 200% growth over the same period, reflecting its robust position in the transportation industry.
These insights not only highlight the dynamic nature of these industries but also offer a glimpse into the strategic decisions driving these companies forward.
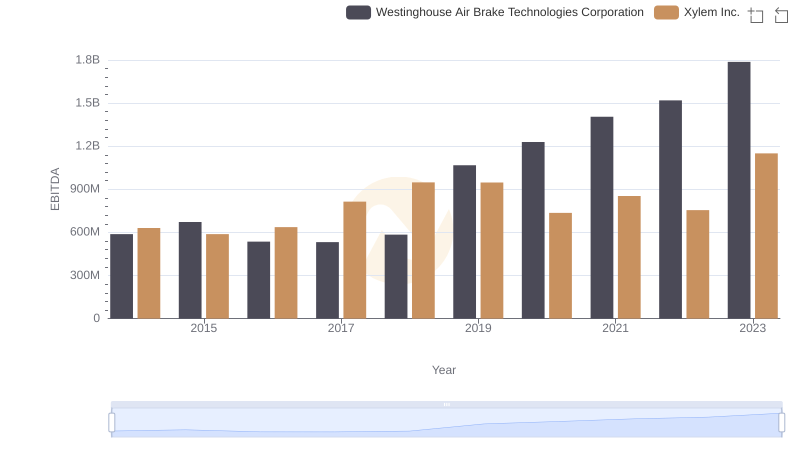
A Professional Review of EBITDA: Westinghouse Air Brake Technologies Corporation Compared to Xylem Inc.
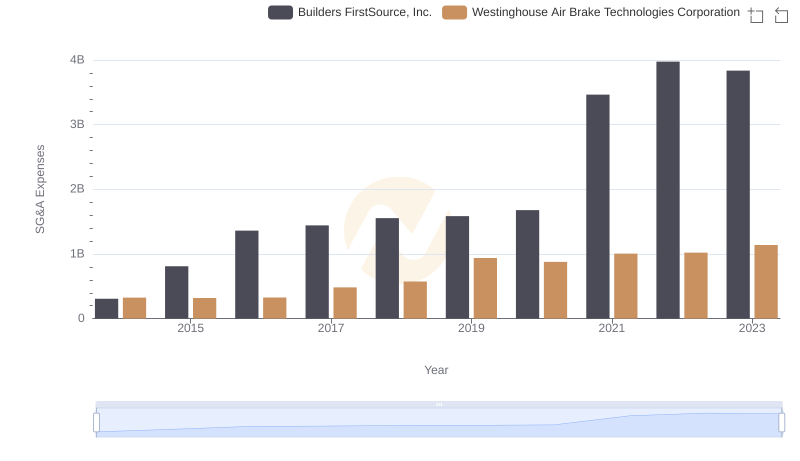
Who Optimizes SG&A Costs Better? Westinghouse Air Brake Technologies Corporation or Builders FirstSource, Inc.

Comparative EBITDA Analysis: Westinghouse Air Brake Technologies Corporation vs Dover Corporation
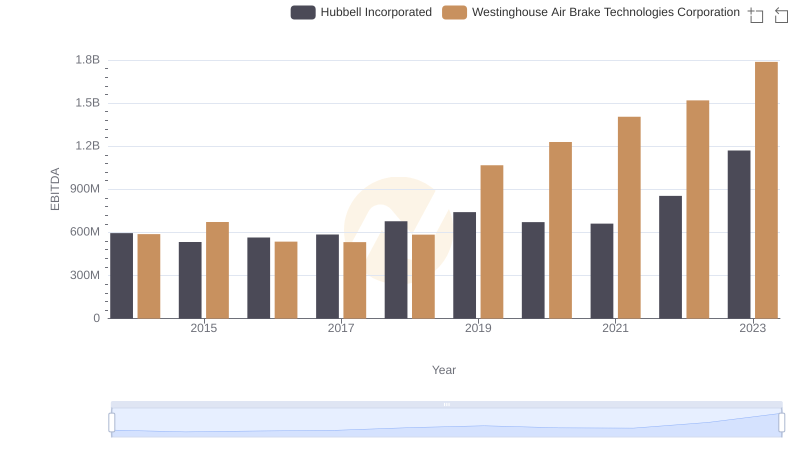
EBITDA Analysis: Evaluating Westinghouse Air Brake Technologies Corporation Against Hubbell Incorporated
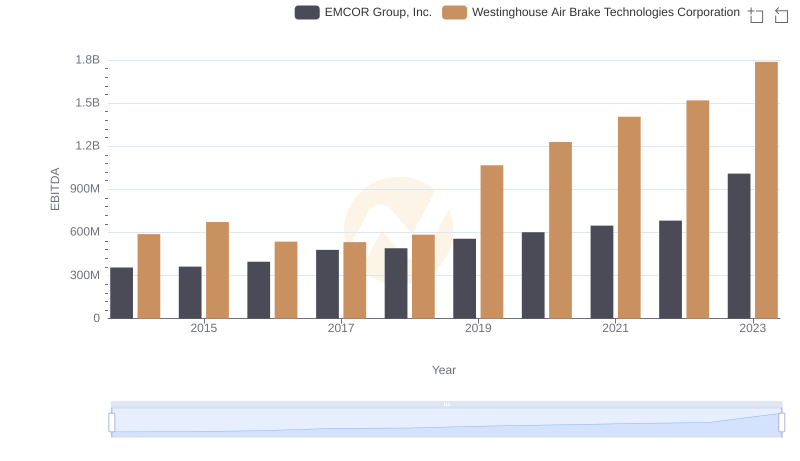
Professional EBITDA Benchmarking: Westinghouse Air Brake Technologies Corporation vs EMCOR Group, Inc.
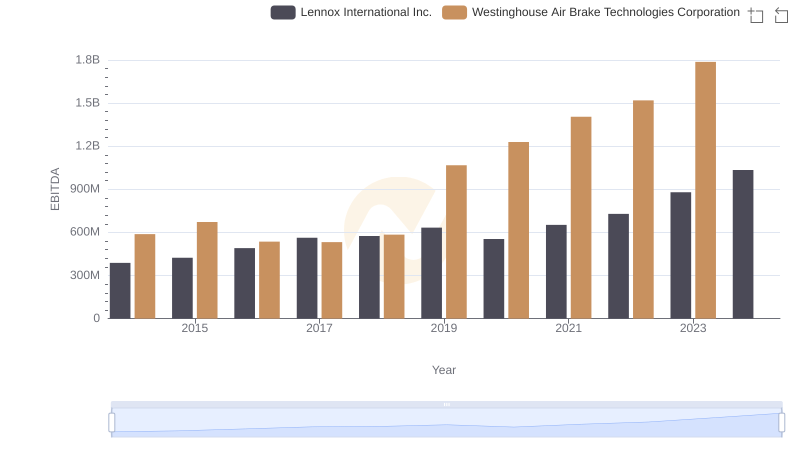
Westinghouse Air Brake Technologies Corporation vs Lennox International Inc.: In-Depth EBITDA Performance Comparison