| __timestamp | EMCOR Group, Inc. | Westinghouse Air Brake Technologies Corporation |
|---|---|---|
| Wednesday, January 1, 2014 | 355858000 | 588370000 |
| Thursday, January 1, 2015 | 362095000 | 672301000 |
| Friday, January 1, 2016 | 395913000 | 535893000 |
| Sunday, January 1, 2017 | 478459000 | 532795000 |
| Monday, January 1, 2018 | 489954000 | 584199000 |
| Tuesday, January 1, 2019 | 556055000 | 1067300000 |
| Wednesday, January 1, 2020 | 601449000 | 1229400000 |
| Friday, January 1, 2021 | 646861000 | 1405000000 |
| Saturday, January 1, 2022 | 682399000 | 1519000000 |
| Sunday, January 1, 2023 | 1009017000 | 1787000000 |
| Monday, January 1, 2024 | 1609000000 |
Infusing magic into the data realm
In the competitive landscape of industrial services, Westinghouse Air Brake Technologies Corporation and EMCOR Group, Inc. have emerged as formidable players. Over the past decade, from 2014 to 2023, these companies have demonstrated significant growth in their EBITDA, a key indicator of financial health and operational efficiency.
Westinghouse Air Brake Technologies Corporation has consistently outperformed, with its EBITDA growing by approximately 204% from 2014 to 2023. In contrast, EMCOR Group, Inc. has shown a robust growth of around 183% over the same period. Notably, 2023 marked a peak year for both, with Westinghouse reaching nearly 1.8 billion and EMCOR surpassing 1 billion in EBITDA.
This data not only highlights the resilience and strategic prowess of these corporations but also underscores the dynamic nature of the industrial sector. As we look to the future, these trends offer valuable insights for investors and industry analysts alike.
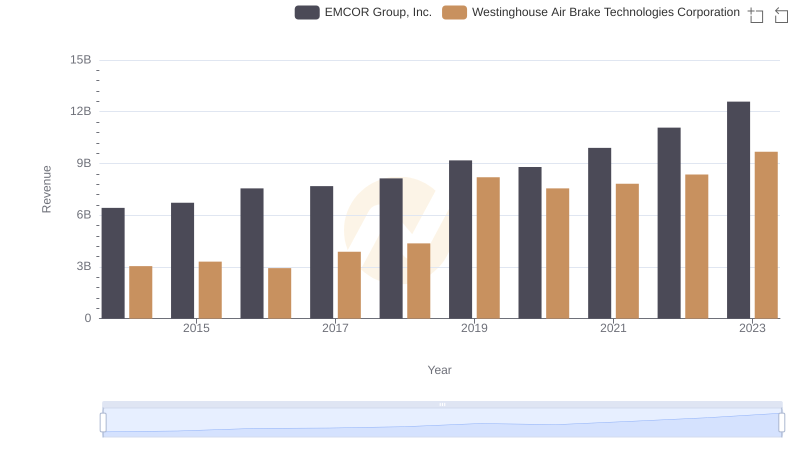
Westinghouse Air Brake Technologies Corporation and EMCOR Group, Inc.: A Comprehensive Revenue Analysis
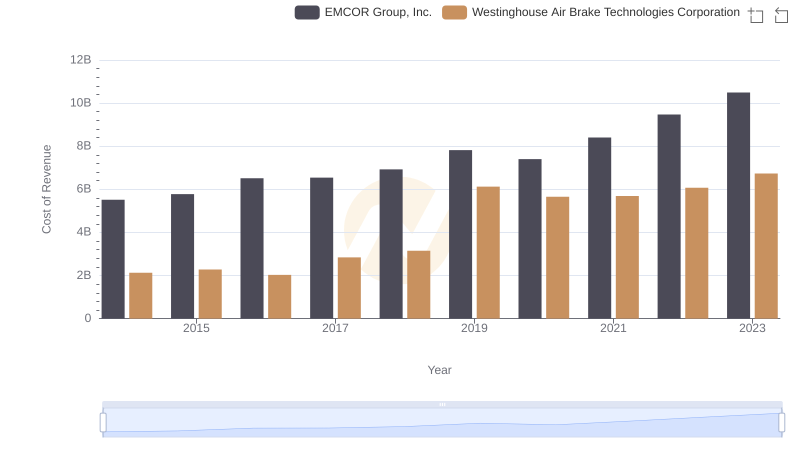
Cost of Revenue Trends: Westinghouse Air Brake Technologies Corporation vs EMCOR Group, Inc.
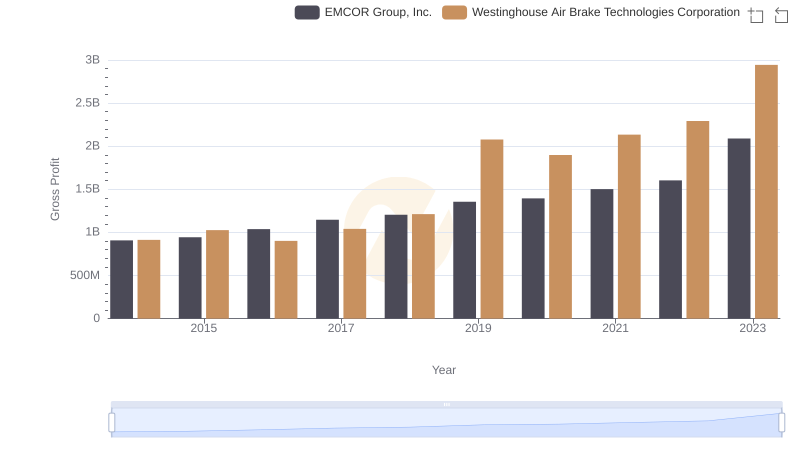
Who Generates Higher Gross Profit? Westinghouse Air Brake Technologies Corporation or EMCOR Group, Inc.
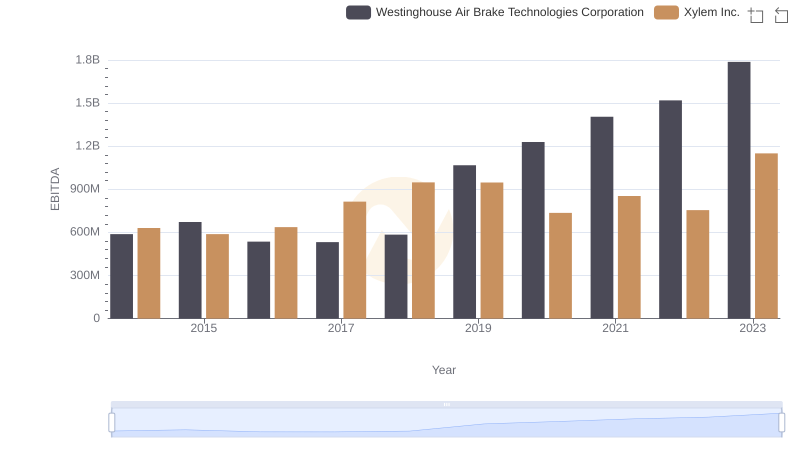
A Professional Review of EBITDA: Westinghouse Air Brake Technologies Corporation Compared to Xylem Inc.

Comparative EBITDA Analysis: Westinghouse Air Brake Technologies Corporation vs Dover Corporation
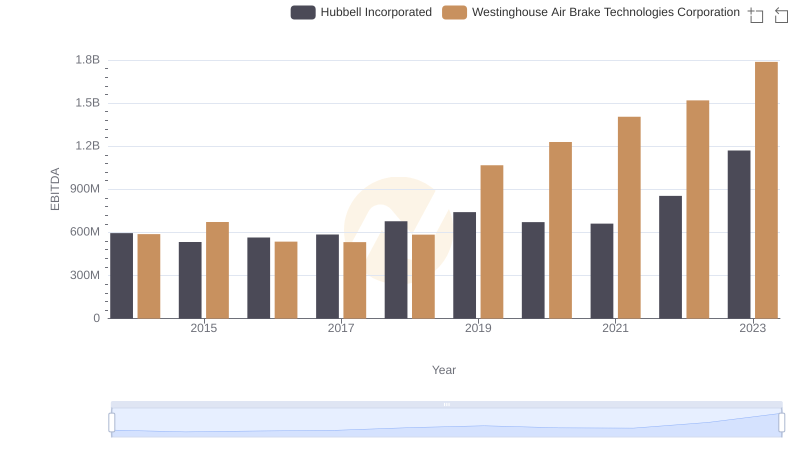
EBITDA Analysis: Evaluating Westinghouse Air Brake Technologies Corporation Against Hubbell Incorporated
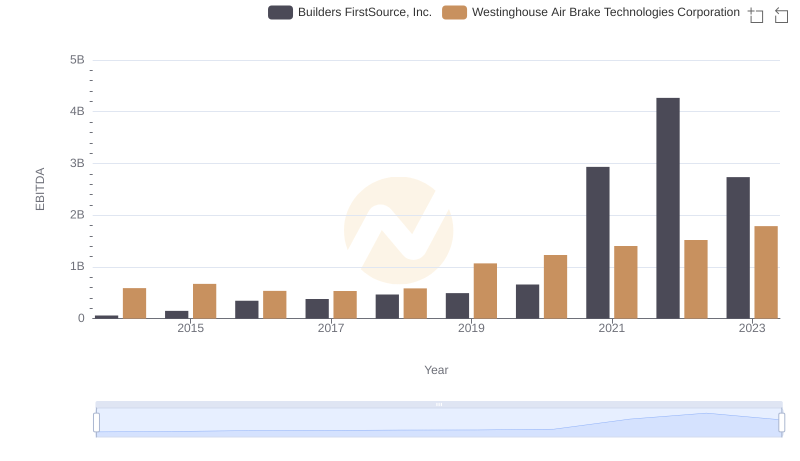
A Side-by-Side Analysis of EBITDA: Westinghouse Air Brake Technologies Corporation and Builders FirstSource, Inc.
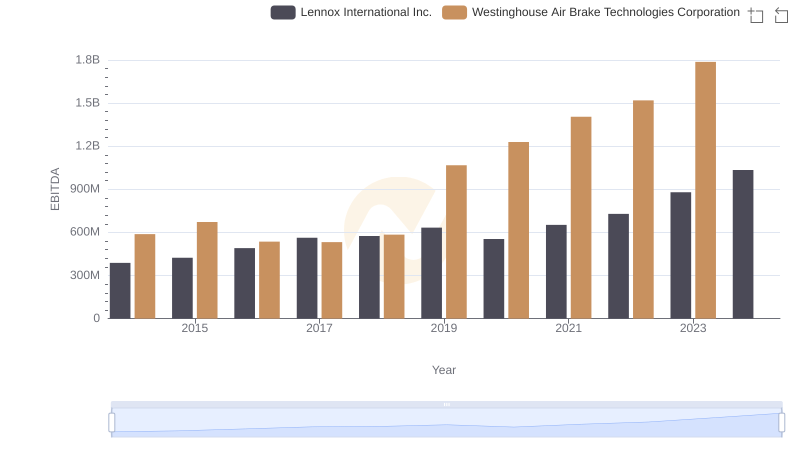
Westinghouse Air Brake Technologies Corporation vs Lennox International Inc.: In-Depth EBITDA Performance Comparison