| __timestamp | Stanley Black & Decker, Inc. | Westinghouse Air Brake Technologies Corporation |
|---|---|---|
| Wednesday, January 1, 2014 | 1975400000 | 588370000 |
| Thursday, January 1, 2015 | 1741900000 | 672301000 |
| Friday, January 1, 2016 | 1810200000 | 535893000 |
| Sunday, January 1, 2017 | 2196000000 | 532795000 |
| Monday, January 1, 2018 | 1791200000 | 584199000 |
| Tuesday, January 1, 2019 | 1920600000 | 1067300000 |
| Wednesday, January 1, 2020 | 2004200000 | 1229400000 |
| Friday, January 1, 2021 | 2345500000 | 1405000000 |
| Saturday, January 1, 2022 | 942800000 | 1519000000 |
| Sunday, January 1, 2023 | 802700000 | 1787000000 |
| Monday, January 1, 2024 | 286300000 | 1609000000 |
Unleashing insights
In the ever-evolving landscape of industrial giants, the EBITDA performance of Westinghouse Air Brake Technologies Corporation and Stanley Black & Decker, Inc. over the past decade offers a fascinating glimpse into their financial trajectories. From 2014 to 2023, Stanley Black & Decker's EBITDA peaked in 2021, showcasing a robust 20% increase from 2014, before experiencing a significant decline of over 60% by 2023. In contrast, Westinghouse Air Brake Technologies demonstrated a steady upward trend, with a remarkable 200% growth in EBITDA from 2014 to 2023, surpassing Stanley Black & Decker in the latter years. This shift highlights Westinghouse's strategic resilience and adaptability in a competitive market. As we delve into these financial narratives, the contrasting paths of these two industrial titans underscore the dynamic nature of business success and the importance of strategic foresight.
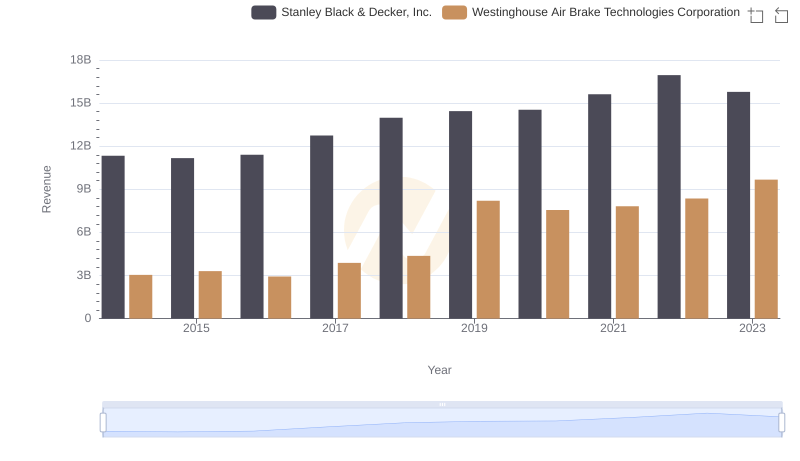
Westinghouse Air Brake Technologies Corporation vs Stanley Black & Decker, Inc.: Examining Key Revenue Metrics
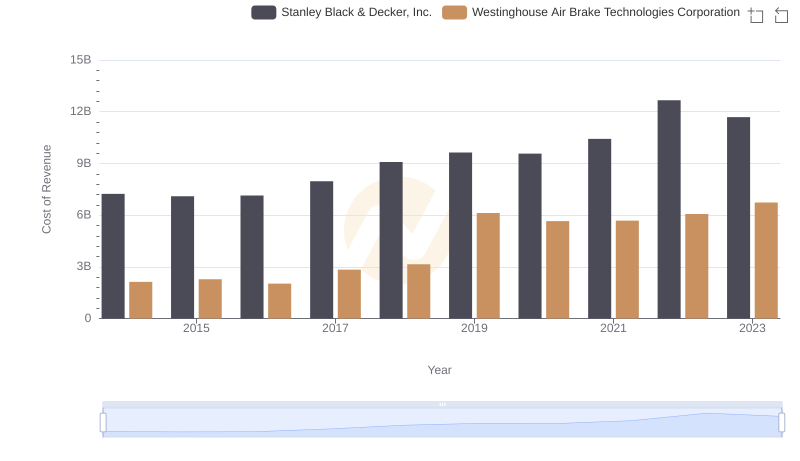
Cost of Revenue Trends: Westinghouse Air Brake Technologies Corporation vs Stanley Black & Decker, Inc.
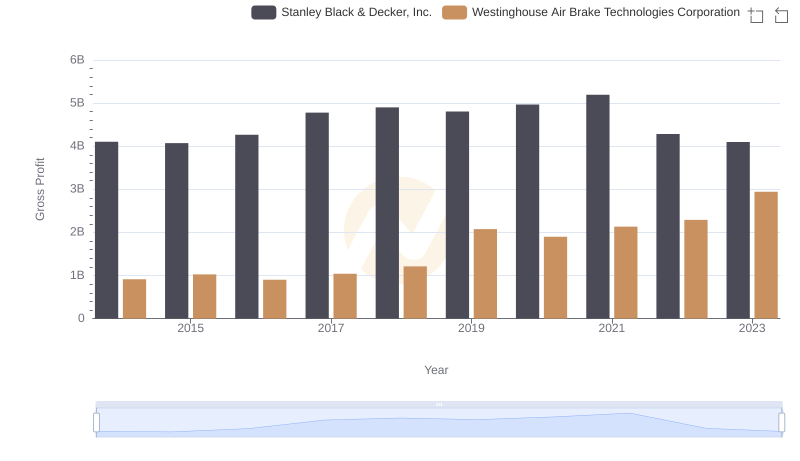
Who Generates Higher Gross Profit? Westinghouse Air Brake Technologies Corporation or Stanley Black & Decker, Inc.

Comparing Innovation Spending: Westinghouse Air Brake Technologies Corporation and Stanley Black & Decker, Inc.
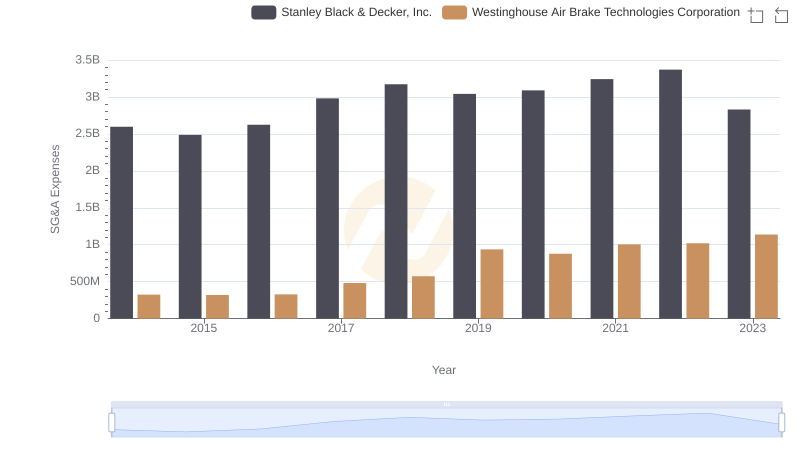
Who Optimizes SG&A Costs Better? Westinghouse Air Brake Technologies Corporation or Stanley Black & Decker, Inc.
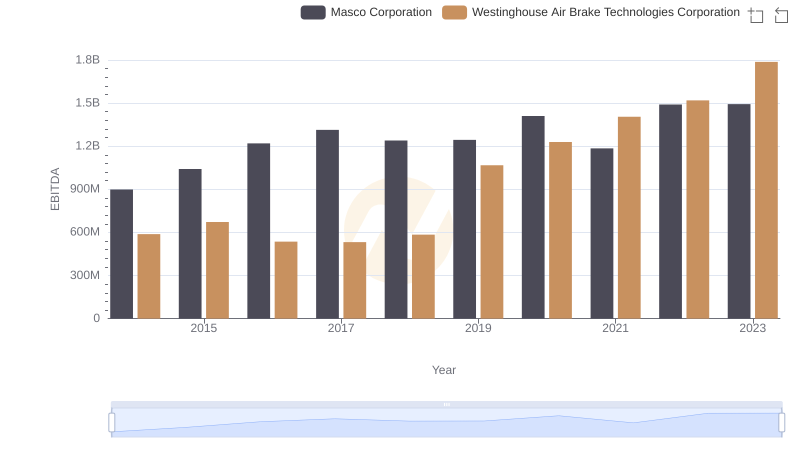
Comparative EBITDA Analysis: Westinghouse Air Brake Technologies Corporation vs Masco Corporation

Breaking Down Revenue Trends: Westinghouse Air Brake Technologies Corporation vs Stanley Black & Decker, Inc.

Cost of Revenue Comparison: Westinghouse Air Brake Technologies Corporation vs Stanley Black & Decker, Inc.

Who Generates Higher Gross Profit? Westinghouse Air Brake Technologies Corporation or Stanley Black & Decker, Inc.
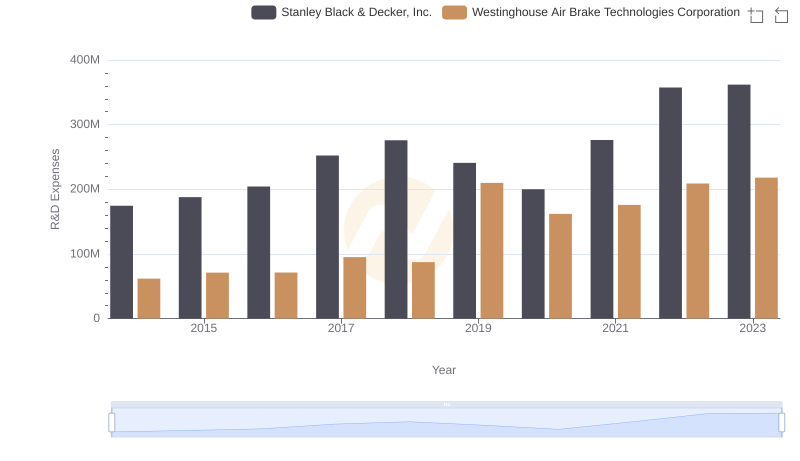
Westinghouse Air Brake Technologies Corporation vs Stanley Black & Decker, Inc.: Strategic Focus on R&D Spending

Selling, General, and Administrative Costs: Westinghouse Air Brake Technologies Corporation vs Stanley Black & Decker, Inc.
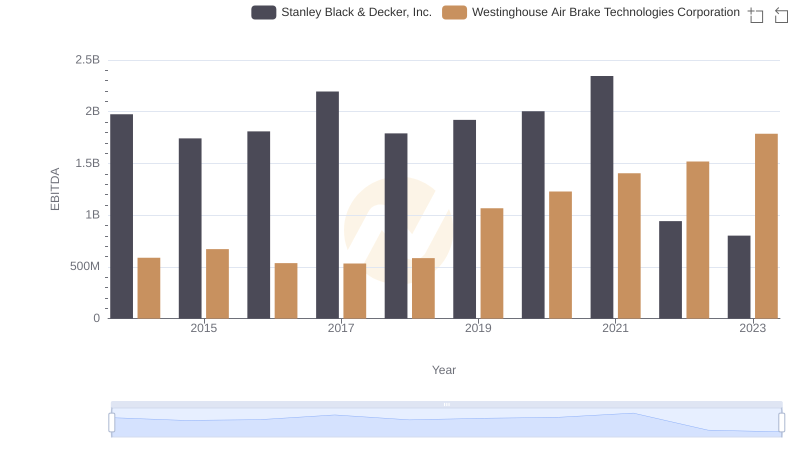
Westinghouse Air Brake Technologies Corporation and Stanley Black & Decker, Inc.: A Detailed Examination of EBITDA Performance