| __timestamp | Lennox International Inc. | Westinghouse Air Brake Technologies Corporation |
|---|---|---|
| Wednesday, January 1, 2014 | 903300000 | 913534000 |
| Thursday, January 1, 2015 | 947400000 | 1026153000 |
| Friday, January 1, 2016 | 1076500000 | 901541000 |
| Sunday, January 1, 2017 | 1125200000 | 1040597000 |
| Monday, January 1, 2018 | 1111200000 | 1211731000 |
| Tuesday, January 1, 2019 | 1079800000 | 2077600000 |
| Wednesday, January 1, 2020 | 1040100000 | 1898700000 |
| Friday, January 1, 2021 | 1188400000 | 2135000000 |
| Saturday, January 1, 2022 | 1284700000 | 2292000000 |
| Sunday, January 1, 2023 | 1547800000 | 2944000000 |
| Monday, January 1, 2024 | 1771900000 | 3366000000 |
Unleashing insights
In the ever-evolving landscape of the industrial sector, two titans, Westinghouse Air Brake Technologies Corporation and Lennox International Inc., have showcased intriguing trends in their gross profits over the past decade. From 2014 to 2023, Lennox International Inc. experienced a steady growth in gross profit, with an impressive 96% increase, peaking in 2023. Meanwhile, Westinghouse Air Brake Technologies Corporation demonstrated a more volatile trajectory, culminating in a remarkable 222% surge by 2023. This comparison highlights the resilience and strategic prowess of these companies in navigating market challenges. Notably, the data for 2024 is incomplete, leaving room for speculation on future performance. As these industry leaders continue to innovate, their financial journeys offer valuable insights into the broader economic trends shaping the industrial sector.

Westinghouse Air Brake Technologies Corporation vs Lennox International Inc.: Examining Key Revenue Metrics
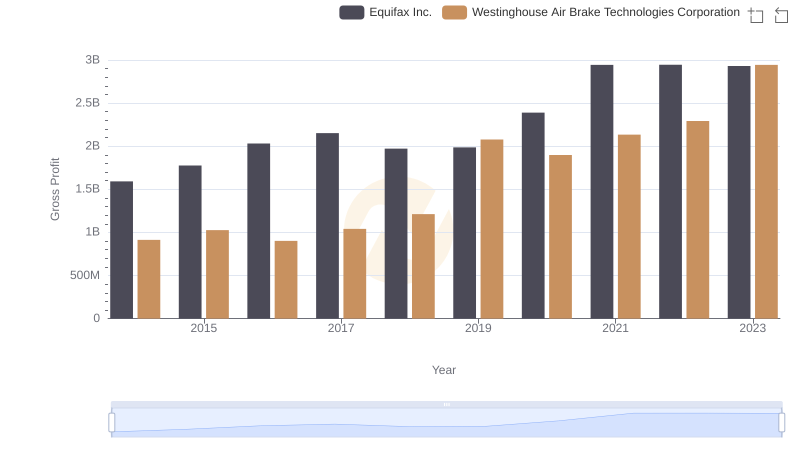
Westinghouse Air Brake Technologies Corporation vs Equifax Inc.: A Gross Profit Performance Breakdown
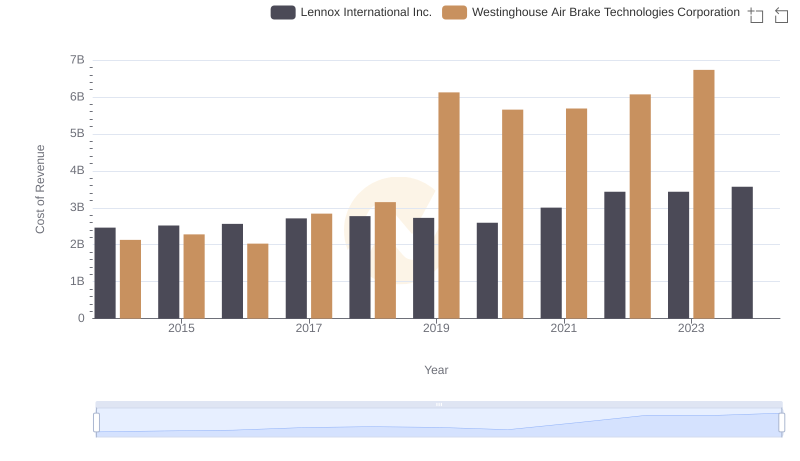
Westinghouse Air Brake Technologies Corporation vs Lennox International Inc.: Efficiency in Cost of Revenue Explored
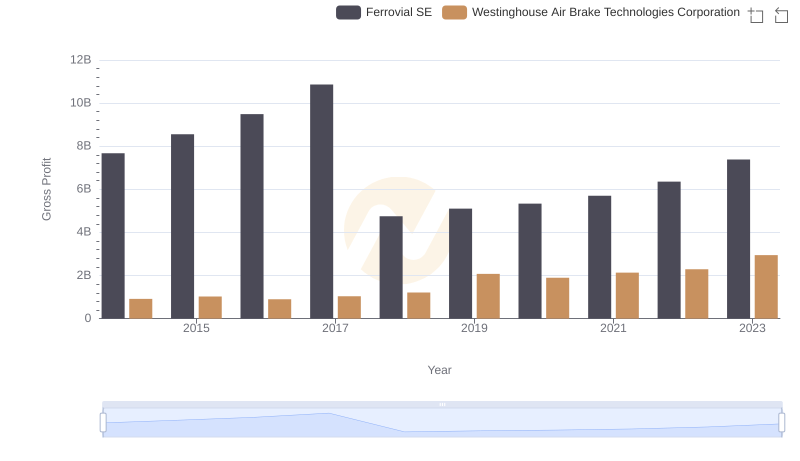
Gross Profit Analysis: Comparing Westinghouse Air Brake Technologies Corporation and Ferrovial SE
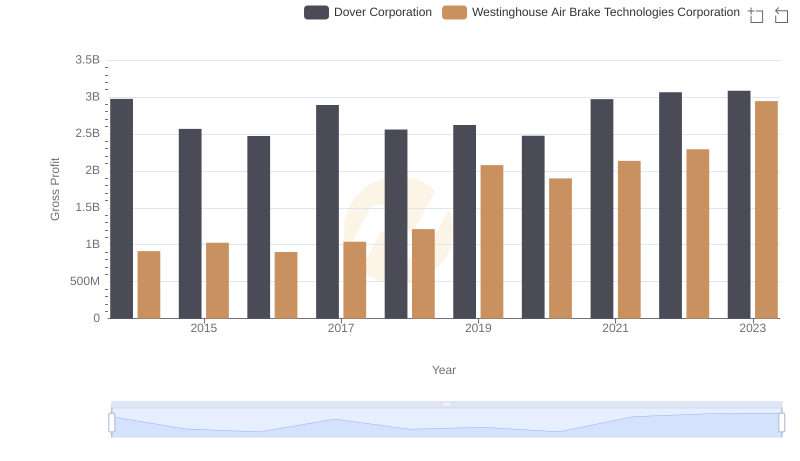
Gross Profit Comparison: Westinghouse Air Brake Technologies Corporation and Dover Corporation Trends
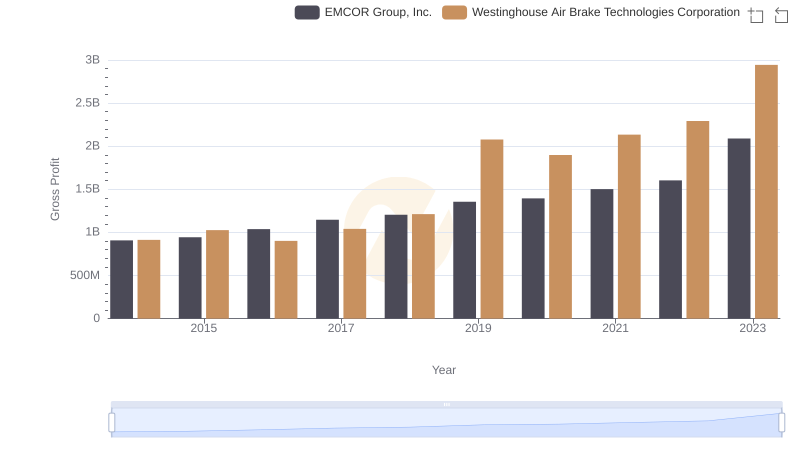
Who Generates Higher Gross Profit? Westinghouse Air Brake Technologies Corporation or EMCOR Group, Inc.
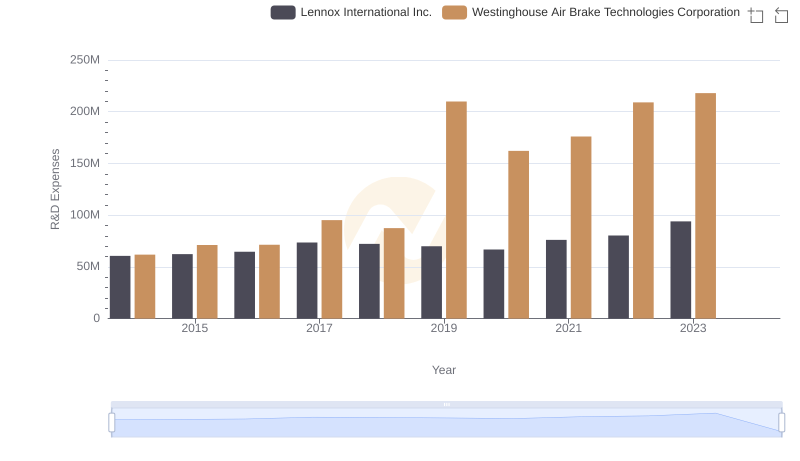
Research and Development Expenses Breakdown: Westinghouse Air Brake Technologies Corporation vs Lennox International Inc.
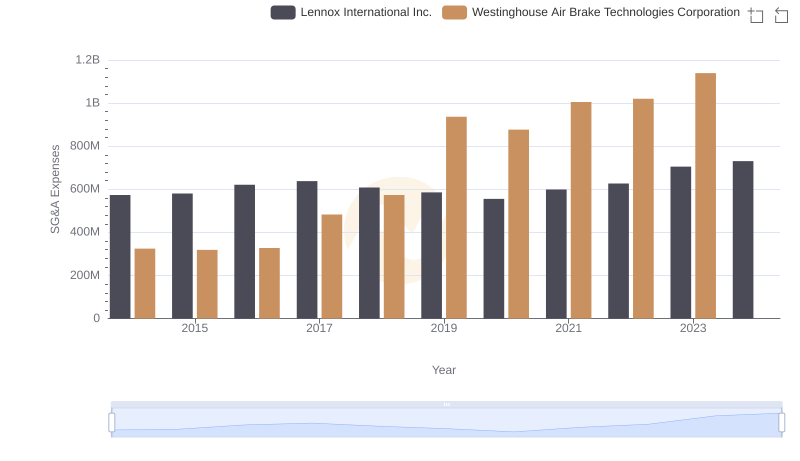
SG&A Efficiency Analysis: Comparing Westinghouse Air Brake Technologies Corporation and Lennox International Inc.
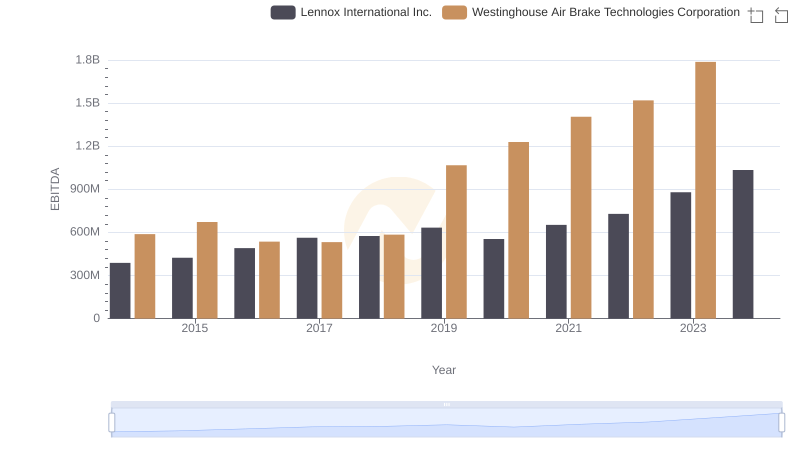
Westinghouse Air Brake Technologies Corporation vs Lennox International Inc.: In-Depth EBITDA Performance Comparison