| __timestamp | Hubbell Incorporated | Westinghouse Air Brake Technologies Corporation |
|---|---|---|
| Wednesday, January 1, 2014 | 594700000 | 588370000 |
| Thursday, January 1, 2015 | 533600000 | 672301000 |
| Friday, January 1, 2016 | 564700000 | 535893000 |
| Sunday, January 1, 2017 | 585600000 | 532795000 |
| Monday, January 1, 2018 | 677500000 | 584199000 |
| Tuesday, January 1, 2019 | 740900000 | 1067300000 |
| Wednesday, January 1, 2020 | 671400000 | 1229400000 |
| Friday, January 1, 2021 | 661000000 | 1405000000 |
| Saturday, January 1, 2022 | 854300000 | 1519000000 |
| Sunday, January 1, 2023 | 1169700000 | 1787000000 |
| Monday, January 1, 2024 | 1291200000 | 1609000000 |
In pursuit of knowledge
In the ever-evolving landscape of industrial technology, Westinghouse Air Brake Technologies Corporation and Hubbell Incorporated have emerged as formidable players. Over the past decade, from 2014 to 2023, these companies have demonstrated significant growth in their EBITDA, a key indicator of financial health and operational efficiency.
Westinghouse has shown a remarkable upward trajectory, with its EBITDA increasing by approximately 204% from 2014 to 2023. This growth reflects the company's strategic initiatives and robust market positioning. In contrast, Hubbell's EBITDA has grown by about 97% over the same period, showcasing its resilience and adaptability in a competitive market.
The data reveals a pivotal year in 2019 when Westinghouse's EBITDA surpassed Hubbell's, marking a turning point in their financial narratives. As we look to the future, these trends offer valuable insights into the strategic directions and potential growth opportunities for both companies.
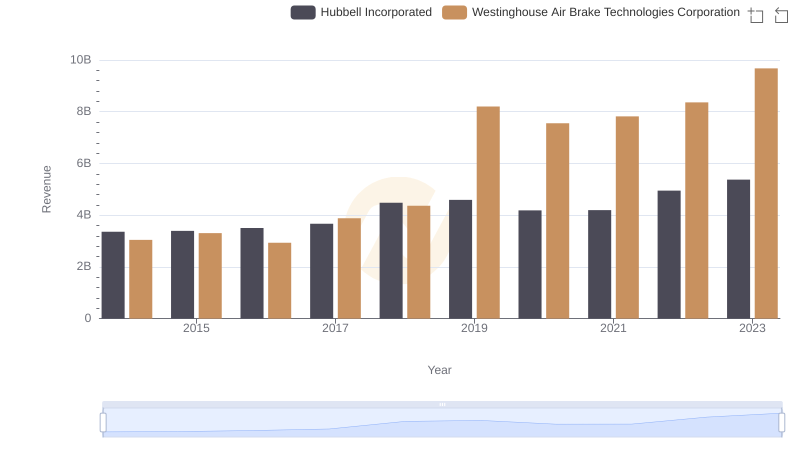
Revenue Showdown: Westinghouse Air Brake Technologies Corporation vs Hubbell Incorporated
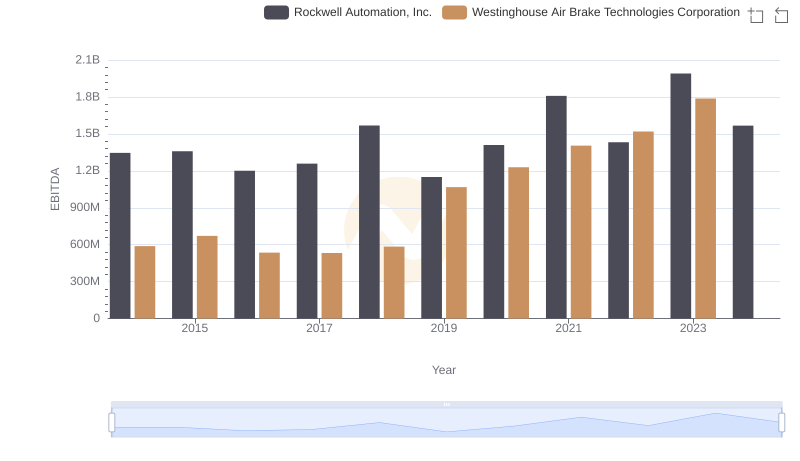
Westinghouse Air Brake Technologies Corporation and Rockwell Automation, Inc.: A Detailed Examination of EBITDA Performance
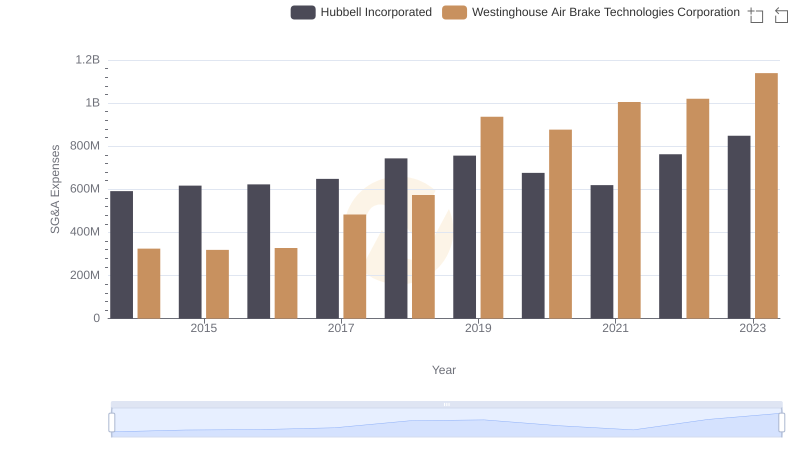
SG&A Efficiency Analysis: Comparing Westinghouse Air Brake Technologies Corporation and Hubbell Incorporated
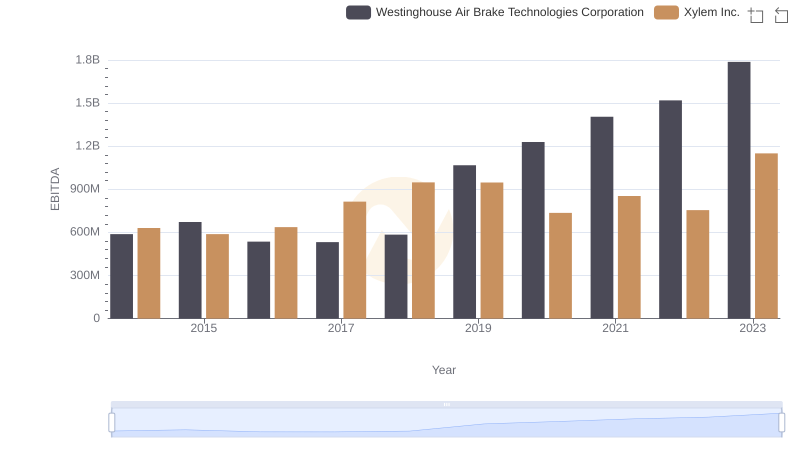
A Professional Review of EBITDA: Westinghouse Air Brake Technologies Corporation Compared to Xylem Inc.

Comparative EBITDA Analysis: Westinghouse Air Brake Technologies Corporation vs Dover Corporation
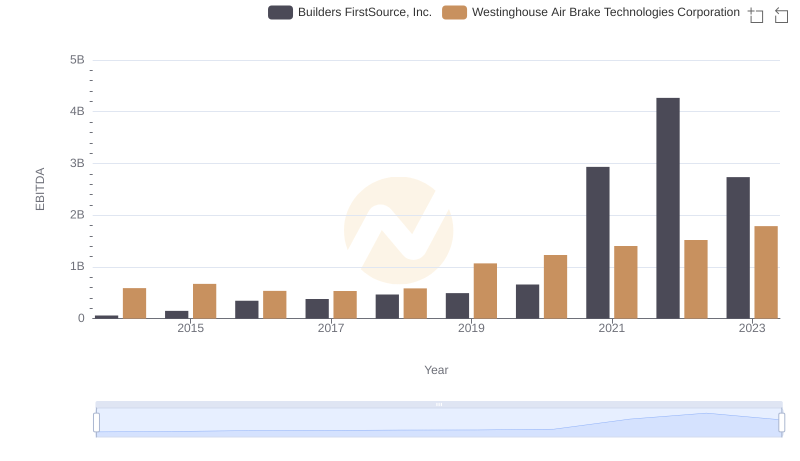
A Side-by-Side Analysis of EBITDA: Westinghouse Air Brake Technologies Corporation and Builders FirstSource, Inc.
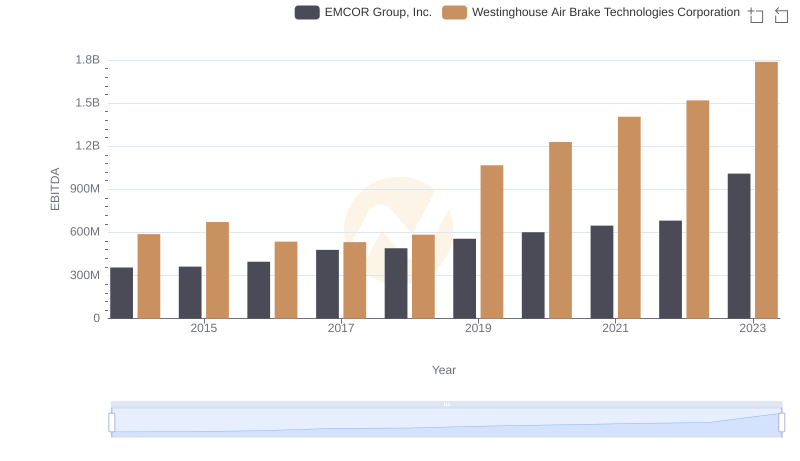
Professional EBITDA Benchmarking: Westinghouse Air Brake Technologies Corporation vs EMCOR Group, Inc.
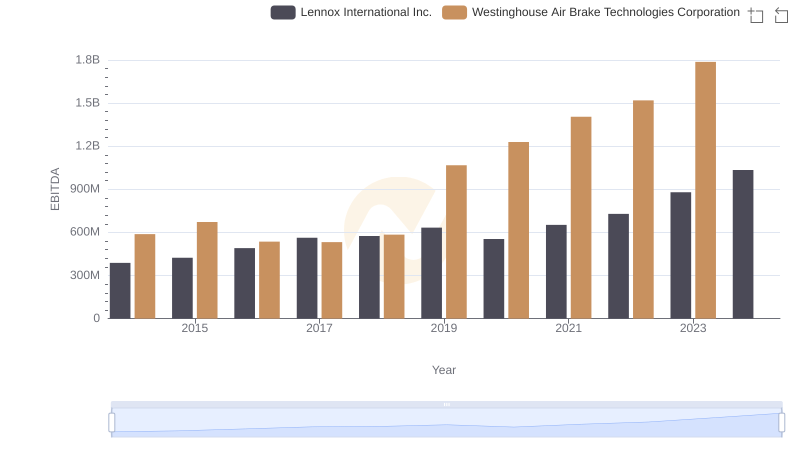
Westinghouse Air Brake Technologies Corporation vs Lennox International Inc.: In-Depth EBITDA Performance Comparison