| __timestamp | Lennox International Inc. | Westinghouse Air Brake Technologies Corporation |
|---|---|---|
| Wednesday, January 1, 2014 | 3367400000 | 3044454000 |
| Thursday, January 1, 2015 | 3467400000 | 3307998000 |
| Friday, January 1, 2016 | 3641600000 | 2931188000 |
| Sunday, January 1, 2017 | 3839600000 | 3881756000 |
| Monday, January 1, 2018 | 3883900000 | 4363547000 |
| Tuesday, January 1, 2019 | 3807200000 | 8200000000 |
| Wednesday, January 1, 2020 | 3634100000 | 7556100000 |
| Friday, January 1, 2021 | 4194100000 | 7822000000 |
| Saturday, January 1, 2022 | 4718400000 | 8362000000 |
| Sunday, January 1, 2023 | 4981900000 | 9677000000 |
| Monday, January 1, 2024 | 5341300000 | 10387000000 |
Unlocking the unknown
In the competitive landscape of industrial and climate control sectors, Westinghouse Air Brake Technologies Corporation and Lennox International Inc. have showcased intriguing revenue trajectories over the past decade. From 2014 to 2023, Lennox International Inc. experienced a steady revenue growth of approximately 59%, starting from $3.37 billion and reaching $5.34 billion. This growth reflects a consistent annual increase, highlighting the company's robust market strategies and adaptability.
Conversely, Westinghouse Air Brake Technologies Corporation demonstrated a more volatile yet impressive revenue surge, with a staggering 218% increase from $3.04 billion in 2014 to $9.68 billion in 2023. This remarkable growth underscores the company's aggressive expansion and innovation in the transportation sector. However, data for 2024 remains unavailable, leaving room for speculation on future trends. As these industry leaders continue to evolve, their financial narratives offer valuable insights into market dynamics and strategic foresight.
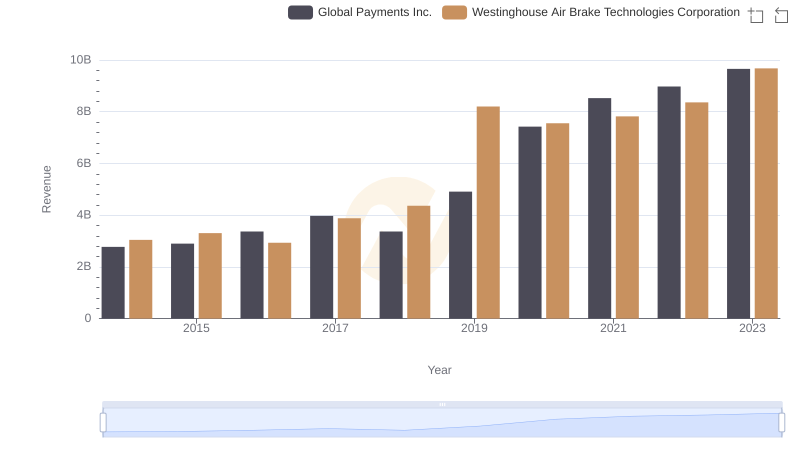
Westinghouse Air Brake Technologies Corporation or Global Payments Inc.: Who Leads in Yearly Revenue?
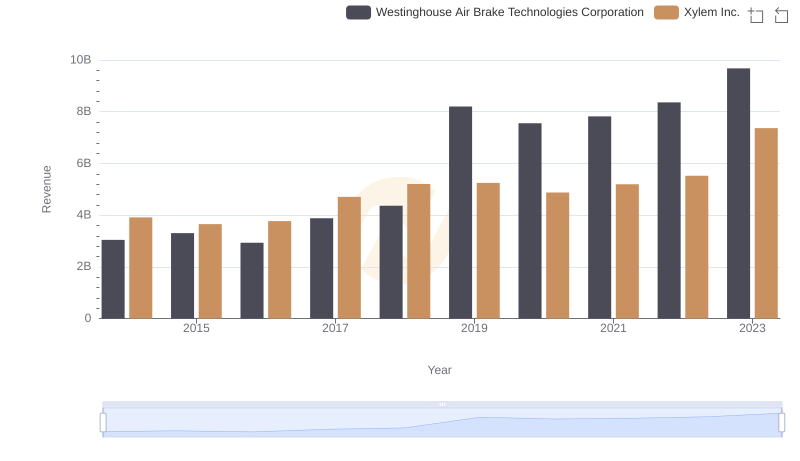
Who Generates More Revenue? Westinghouse Air Brake Technologies Corporation or Xylem Inc.

Westinghouse Air Brake Technologies Corporation vs Ryanair Holdings plc: Examining Key Revenue Metrics
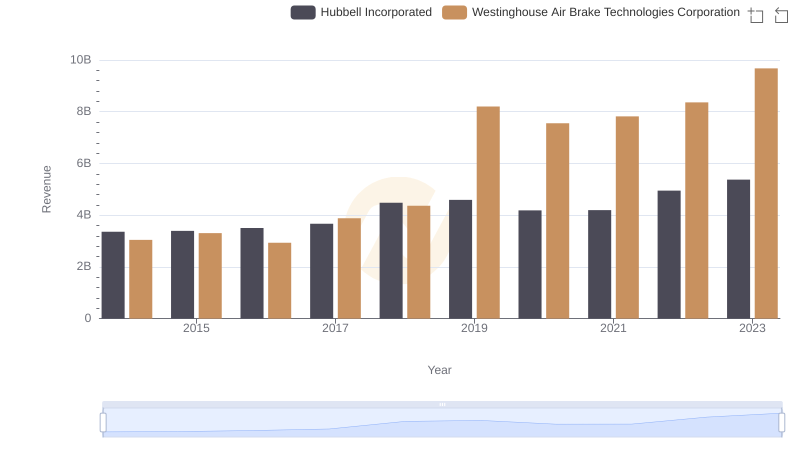
Revenue Showdown: Westinghouse Air Brake Technologies Corporation vs Hubbell Incorporated
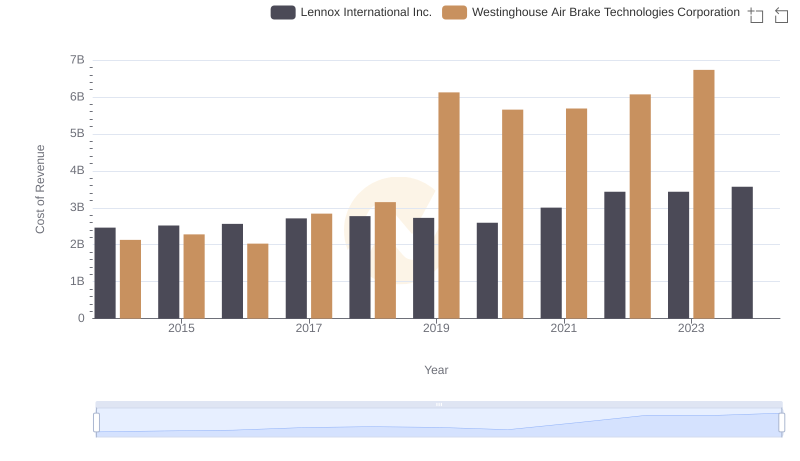
Westinghouse Air Brake Technologies Corporation vs Lennox International Inc.: Efficiency in Cost of Revenue Explored
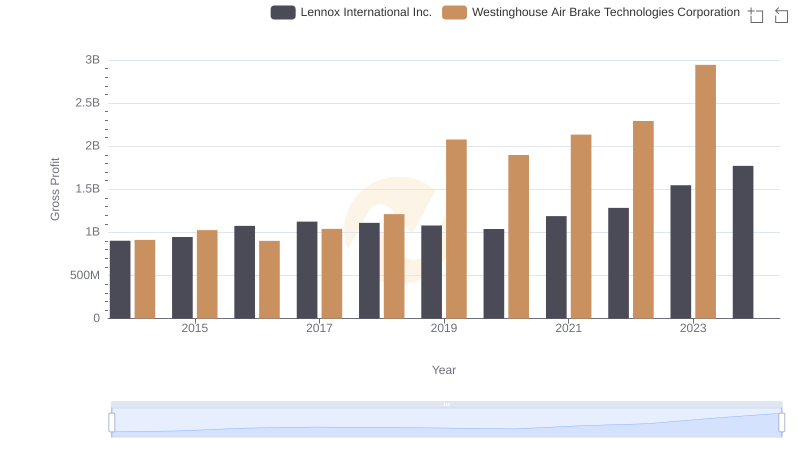
Gross Profit Comparison: Westinghouse Air Brake Technologies Corporation and Lennox International Inc. Trends
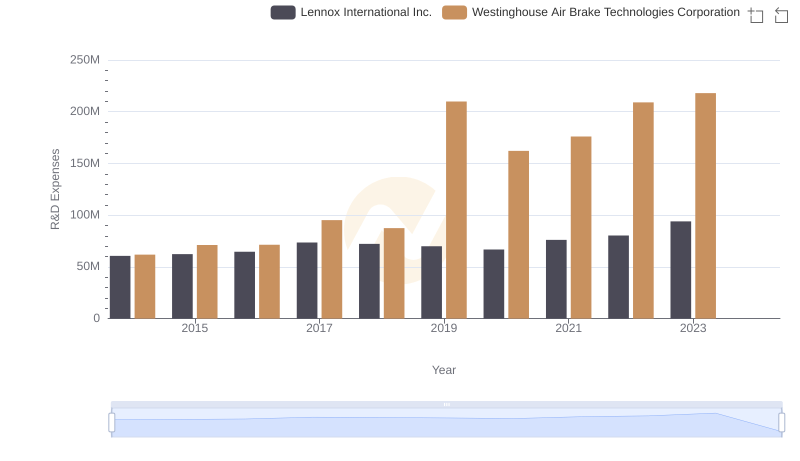
Research and Development Expenses Breakdown: Westinghouse Air Brake Technologies Corporation vs Lennox International Inc.
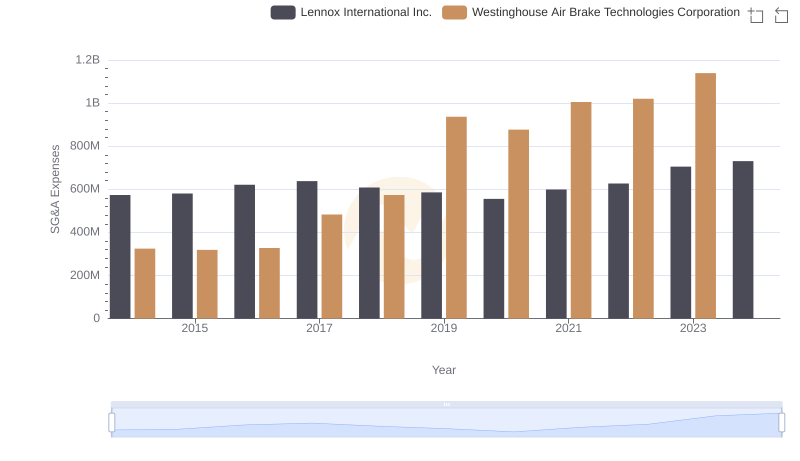
SG&A Efficiency Analysis: Comparing Westinghouse Air Brake Technologies Corporation and Lennox International Inc.
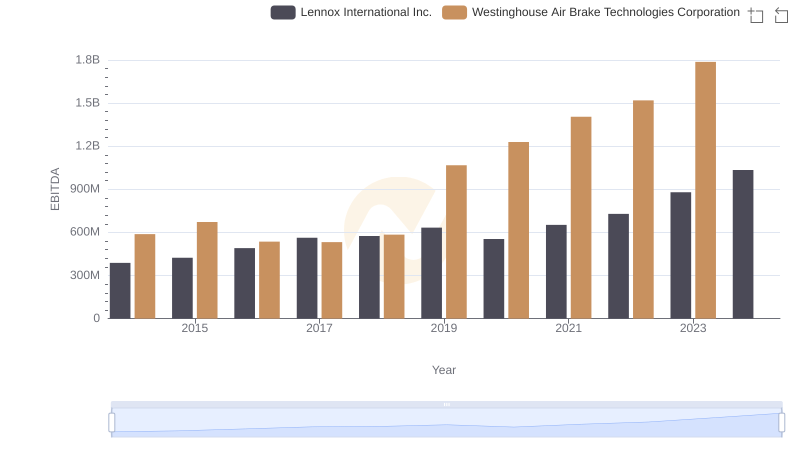
Westinghouse Air Brake Technologies Corporation vs Lennox International Inc.: In-Depth EBITDA Performance Comparison