| __timestamp | TFI International Inc. | Watsco, Inc. |
|---|---|---|
| Wednesday, January 1, 2014 | 2782605137 | 2988138000 |
| Thursday, January 1, 2015 | 2551474032 | 3105882000 |
| Friday, January 1, 2016 | 2636493564 | 3186118000 |
| Sunday, January 1, 2017 | 3364979721 | 3276296000 |
| Monday, January 1, 2018 | 3251443800 | 3426401000 |
| Tuesday, January 1, 2019 | 3461987950 | 3613406000 |
| Wednesday, January 1, 2020 | 3239249000 | 3832107000 |
| Friday, January 1, 2021 | 6182566000 | 4612647000 |
| Saturday, January 1, 2022 | 7385640000 | 5244055000 |
| Sunday, January 1, 2023 | 6255775000 | 5291627000 |
| Monday, January 1, 2024 | 5573604000 |
Infusing magic into the data realm
In the competitive landscape of industrial giants, cost efficiency is a critical metric. This analysis delves into the cost of revenue trends for Watsco, Inc. and TFI International Inc. from 2014 to 2023. Over this decade, TFI International Inc. demonstrated a remarkable 180% increase in cost of revenue, peaking in 2022. Meanwhile, Watsco, Inc. saw a steady 77% rise, with its highest cost recorded in 2023.
This data underscores the dynamic strategies of these industry leaders, offering a window into their operational efficiencies and market adaptations.
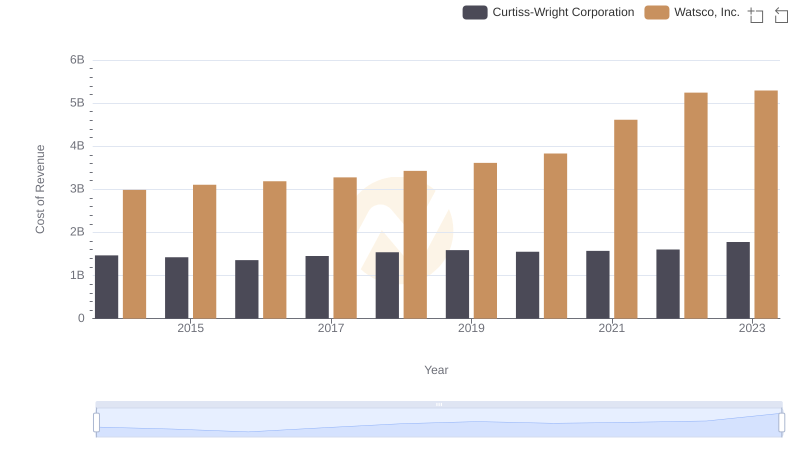
Cost of Revenue Comparison: Watsco, Inc. vs Curtiss-Wright Corporation
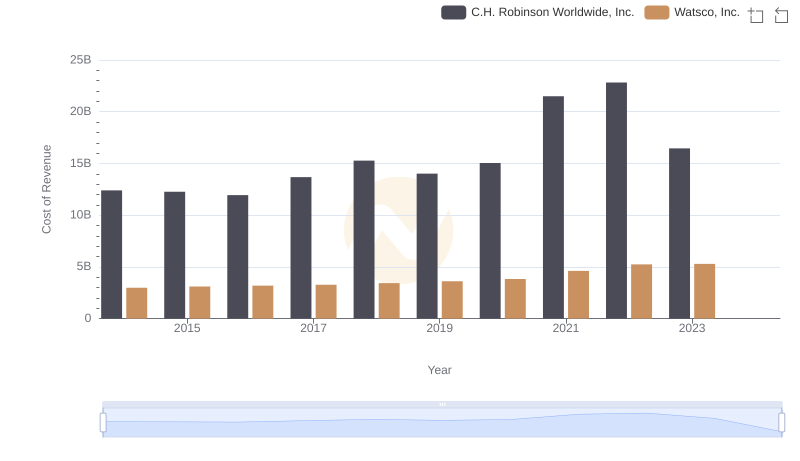
Cost of Revenue Comparison: Watsco, Inc. vs C.H. Robinson Worldwide, Inc.
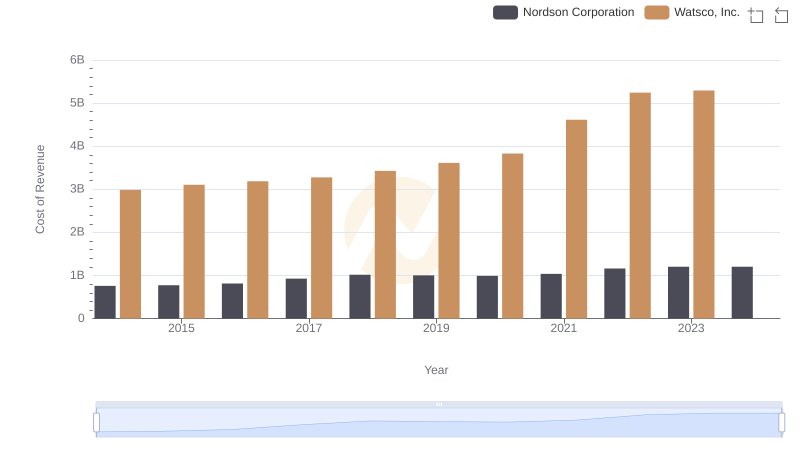
Analyzing Cost of Revenue: Watsco, Inc. and Nordson Corporation
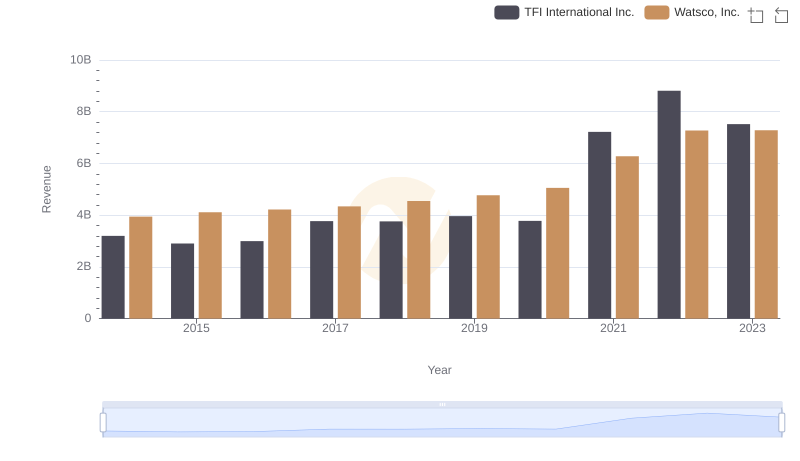
Watsco, Inc. vs TFI International Inc.: Examining Key Revenue Metrics
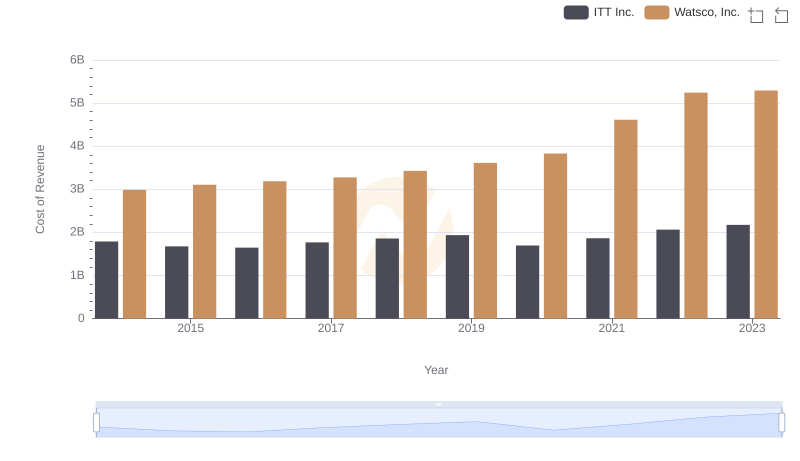
Cost of Revenue Comparison: Watsco, Inc. vs ITT Inc.
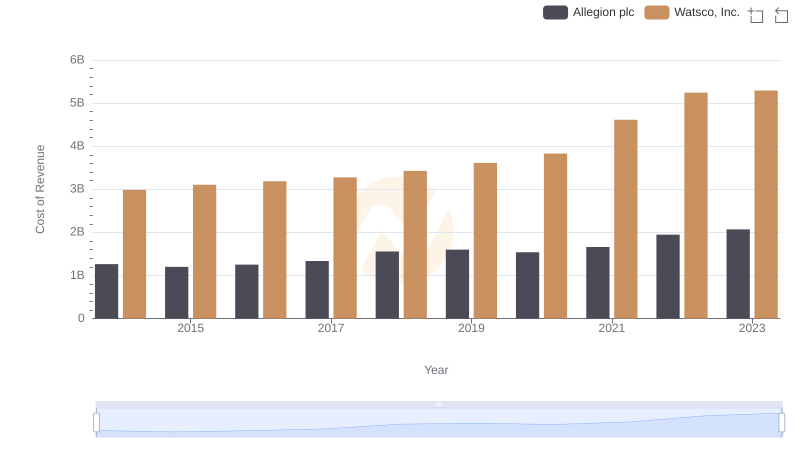
Comparing Cost of Revenue Efficiency: Watsco, Inc. vs Allegion plc
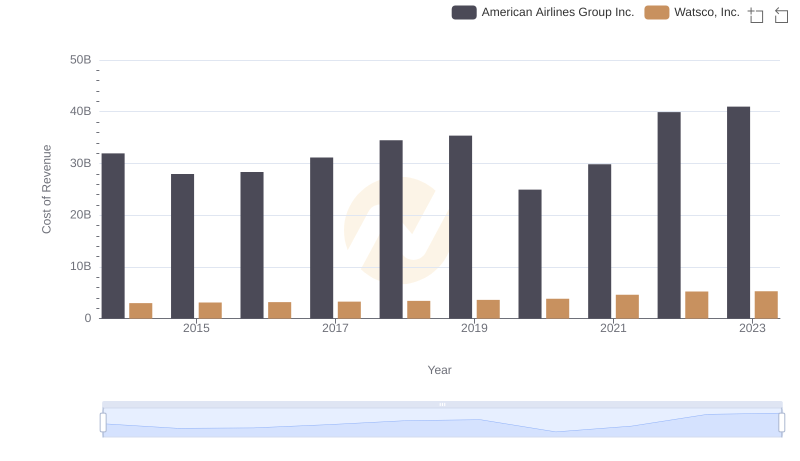
Cost of Revenue: Key Insights for Watsco, Inc. and American Airlines Group Inc.
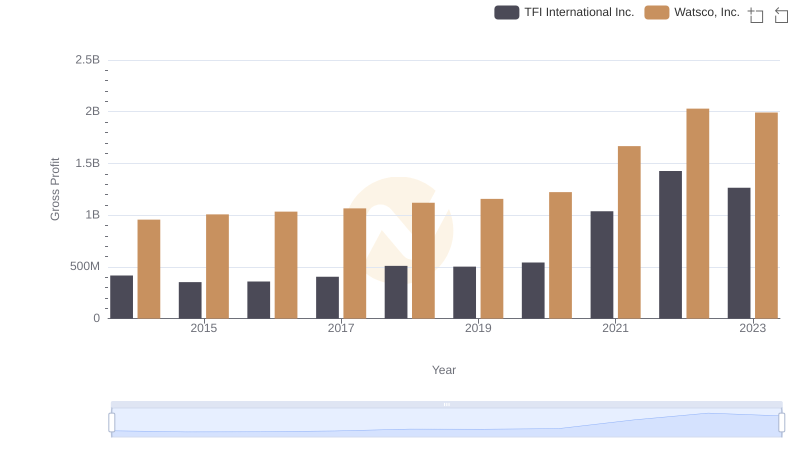
Key Insights on Gross Profit: Watsco, Inc. vs TFI International Inc.
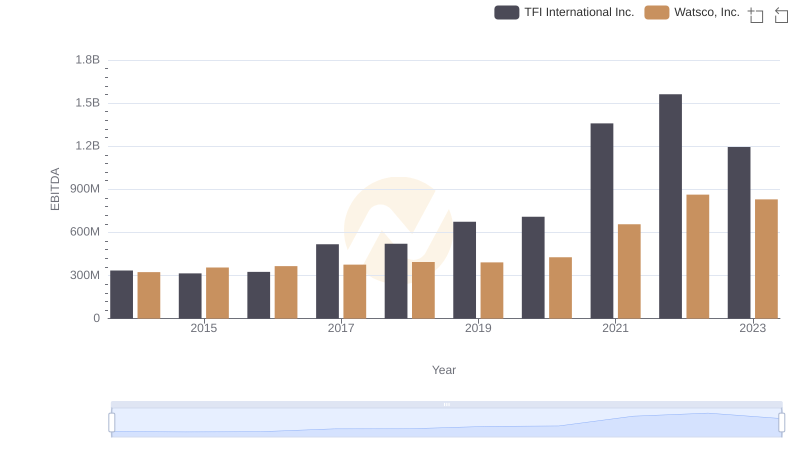
Watsco, Inc. vs TFI International Inc.: In-Depth EBITDA Performance Comparison