| __timestamp | Allegion plc | Watsco, Inc. |
|---|---|---|
| Wednesday, January 1, 2014 | 1264600000 | 2988138000 |
| Thursday, January 1, 2015 | 1199000000 | 3105882000 |
| Friday, January 1, 2016 | 1252700000 | 3186118000 |
| Sunday, January 1, 2017 | 1337500000 | 3276296000 |
| Monday, January 1, 2018 | 1558400000 | 3426401000 |
| Tuesday, January 1, 2019 | 1601700000 | 3613406000 |
| Wednesday, January 1, 2020 | 1541100000 | 3832107000 |
| Friday, January 1, 2021 | 1662500000 | 4612647000 |
| Saturday, January 1, 2022 | 1949500000 | 5244055000 |
| Sunday, January 1, 2023 | 2069300000 | 5291627000 |
| Monday, January 1, 2024 | 2103700000 | 5573604000 |
Igniting the spark of knowledge
In the competitive landscape of industrial and building solutions, Watsco, Inc. and Allegion plc stand out with their distinct approaches to cost management. Over the past decade, from 2014 to 2023, Watsco, Inc. has consistently demonstrated a robust growth in cost of revenue, peaking at approximately $5.29 billion in 2023. This represents a remarkable increase of nearly 77% from its 2014 figures. In contrast, Allegion plc, while also experiencing growth, has shown a more modest increase of around 64% over the same period, reaching about $2.07 billion in 2023.
This divergence highlights Watsco's aggressive expansion and operational scaling, while Allegion's steady growth reflects a more conservative approach. As these companies navigate the evolving market dynamics, their cost efficiency strategies will be pivotal in shaping their future trajectories.
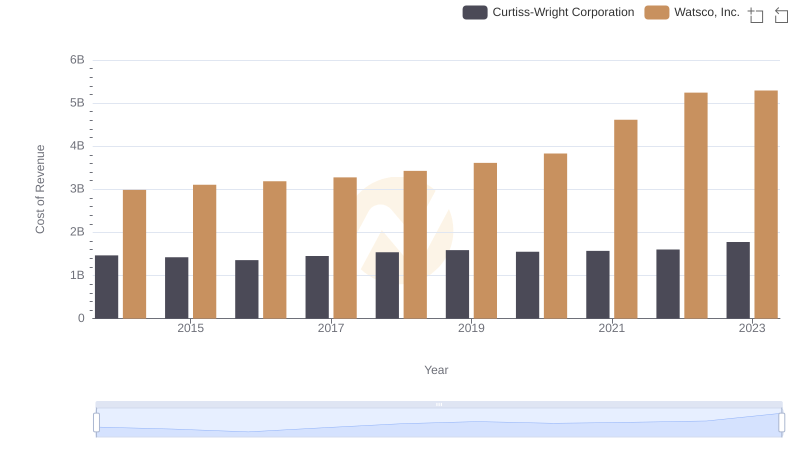
Cost of Revenue Comparison: Watsco, Inc. vs Curtiss-Wright Corporation
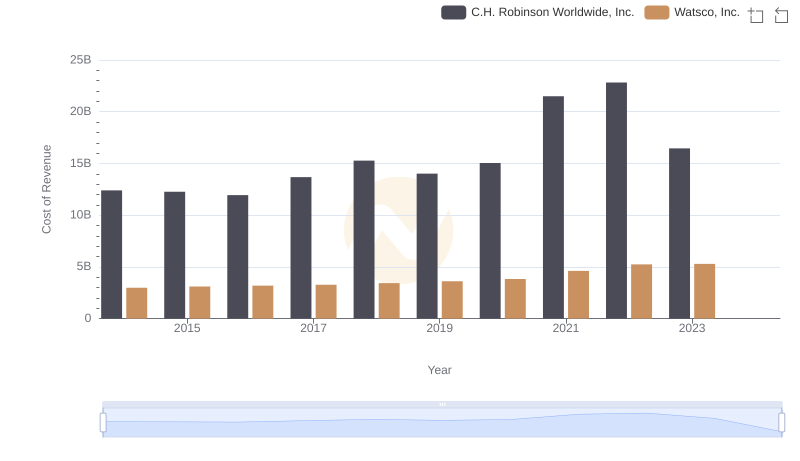
Cost of Revenue Comparison: Watsco, Inc. vs C.H. Robinson Worldwide, Inc.
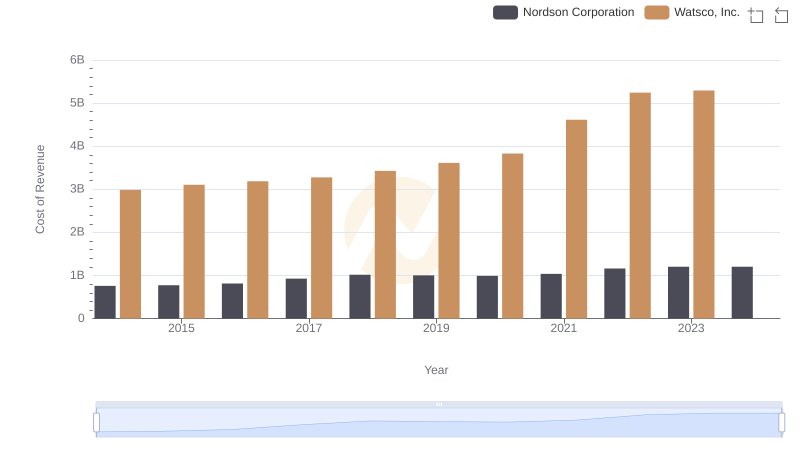
Analyzing Cost of Revenue: Watsco, Inc. and Nordson Corporation
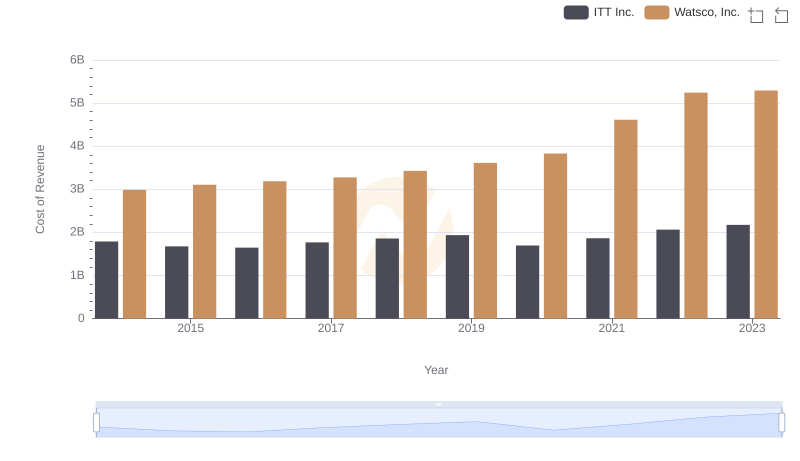
Cost of Revenue Comparison: Watsco, Inc. vs ITT Inc.
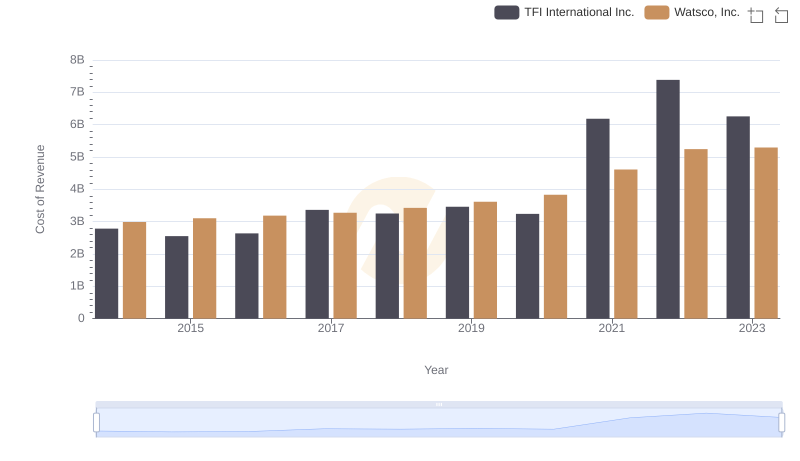
Watsco, Inc. vs TFI International Inc.: Efficiency in Cost of Revenue Explored
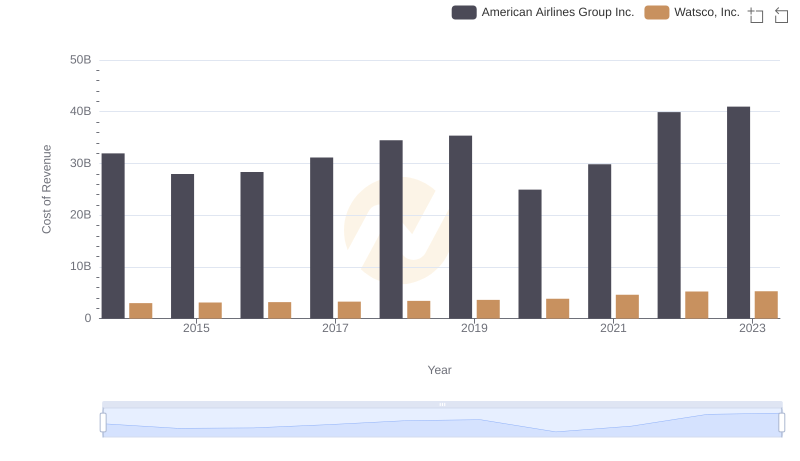
Cost of Revenue: Key Insights for Watsco, Inc. and American Airlines Group Inc.
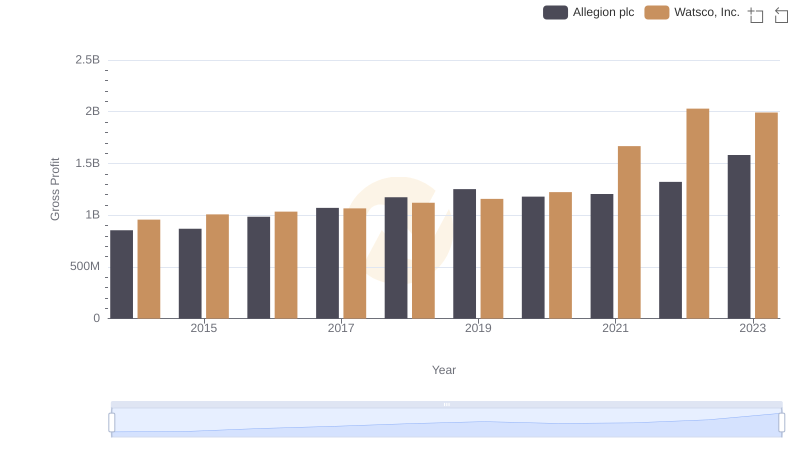
Who Generates Higher Gross Profit? Watsco, Inc. or Allegion plc
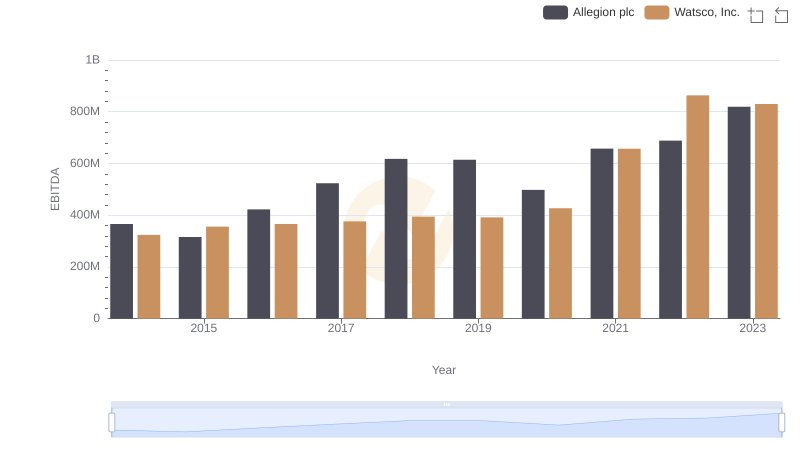
Watsco, Inc. vs Allegion plc: In-Depth EBITDA Performance Comparison