| __timestamp | C.H. Robinson Worldwide, Inc. | Watsco, Inc. |
|---|---|---|
| Wednesday, January 1, 2014 | 12401436000 | 2988138000 |
| Thursday, January 1, 2015 | 12259014000 | 3105882000 |
| Friday, January 1, 2016 | 11931821000 | 3186118000 |
| Sunday, January 1, 2017 | 13680857000 | 3276296000 |
| Monday, January 1, 2018 | 15269479000 | 3426401000 |
| Tuesday, January 1, 2019 | 14021726000 | 3613406000 |
| Wednesday, January 1, 2020 | 15037716000 | 3832107000 |
| Friday, January 1, 2021 | 21493659000 | 4612647000 |
| Saturday, January 1, 2022 | 22826428000 | 5244055000 |
| Sunday, January 1, 2023 | 16457570000 | 5291627000 |
| Monday, January 1, 2024 | 16416191000 | 5573604000 |
Igniting the spark of knowledge
In the ever-evolving landscape of American business, Watsco, Inc. and C.H. Robinson Worldwide, Inc. stand as titans in their respective industries. Over the past decade, these companies have showcased contrasting trajectories in their cost of revenue. From 2014 to 2023, C.H. Robinson's cost of revenue surged by approximately 33%, peaking in 2022. This reflects the company's robust expansion and adaptation to global supply chain demands. Meanwhile, Watsco, Inc. experienced a steady 77% increase, highlighting its strategic growth in the HVAC distribution sector.
Interestingly, 2023 marked a divergence, with C.H. Robinson's costs dropping by 28% from the previous year, possibly indicating efficiency improvements or market shifts. In contrast, Watsco continued its upward trend, reaching its highest recorded cost of revenue. This data not only underscores the dynamic nature of these industries but also offers a glimpse into the strategic maneuvers of these corporate giants.
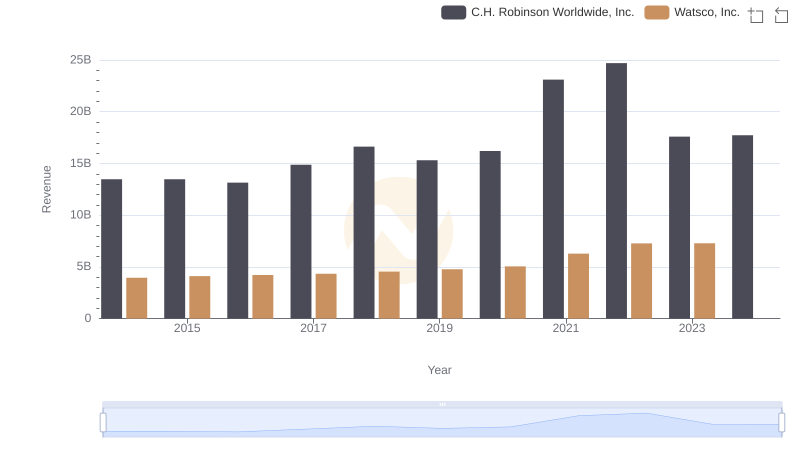
Annual Revenue Comparison: Watsco, Inc. vs C.H. Robinson Worldwide, Inc.
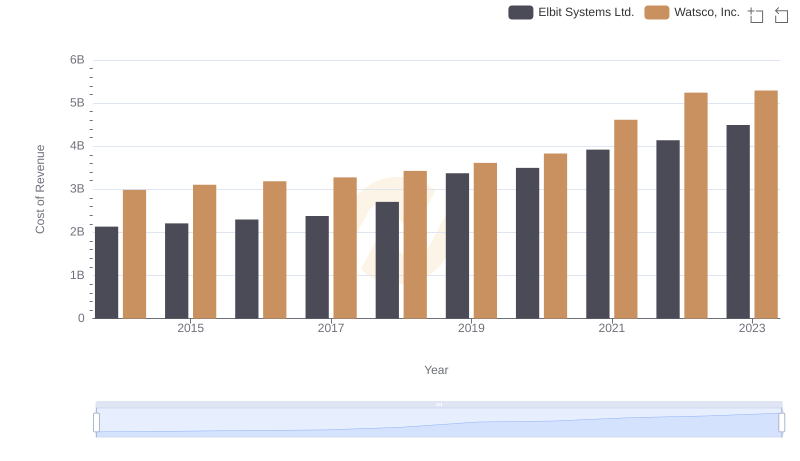
Comparing Cost of Revenue Efficiency: Watsco, Inc. vs Elbit Systems Ltd.
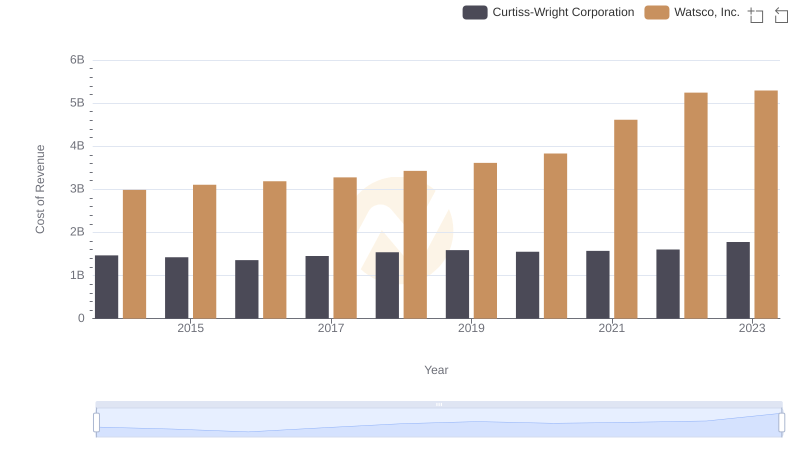
Cost of Revenue Comparison: Watsco, Inc. vs Curtiss-Wright Corporation
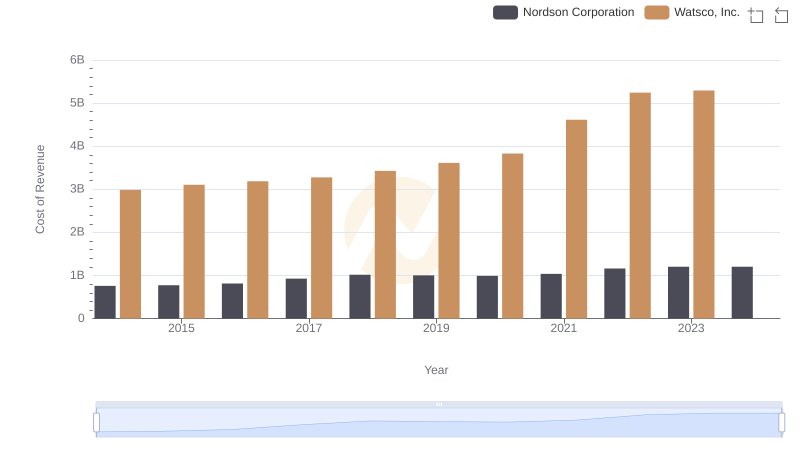
Analyzing Cost of Revenue: Watsco, Inc. and Nordson Corporation
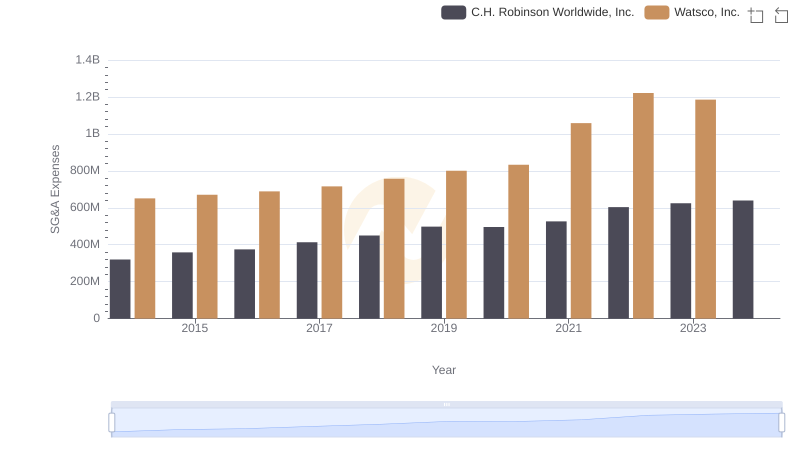
Watsco, Inc. or C.H. Robinson Worldwide, Inc.: Who Manages SG&A Costs Better?