| __timestamp | Nordson Corporation | Watsco, Inc. |
|---|---|---|
| Wednesday, January 1, 2014 | 758923000 | 2988138000 |
| Thursday, January 1, 2015 | 774702000 | 3105882000 |
| Friday, January 1, 2016 | 815495000 | 3186118000 |
| Sunday, January 1, 2017 | 927981000 | 3276296000 |
| Monday, January 1, 2018 | 1018703000 | 3426401000 |
| Tuesday, January 1, 2019 | 1002123000 | 3613406000 |
| Wednesday, January 1, 2020 | 990632000 | 3832107000 |
| Friday, January 1, 2021 | 1038129000 | 4612647000 |
| Saturday, January 1, 2022 | 1163742000 | 5244055000 |
| Sunday, January 1, 2023 | 1203227000 | 5291627000 |
| Monday, January 1, 2024 | 1203792000 | 5573604000 |
In pursuit of knowledge
In the ever-evolving landscape of industrial giants, Watsco, Inc. and Nordson Corporation stand as titans in their respective fields. Over the past decade, from 2014 to 2023, these companies have showcased intriguing trends in their cost of revenue. Watsco, Inc., a leader in HVAC distribution, has seen its cost of revenue soar by approximately 77%, peaking in 2023. Meanwhile, Nordson Corporation, a pioneer in precision technology, experienced a more modest increase of about 58% over the same period. Notably, Watsco's cost of revenue consistently outpaced Nordson's, highlighting its expansive growth strategy. However, the data for 2024 remains incomplete, leaving room for speculation on future trajectories. This analysis not only underscores the dynamic nature of these industries but also invites investors to ponder the strategic decisions driving these financial outcomes.
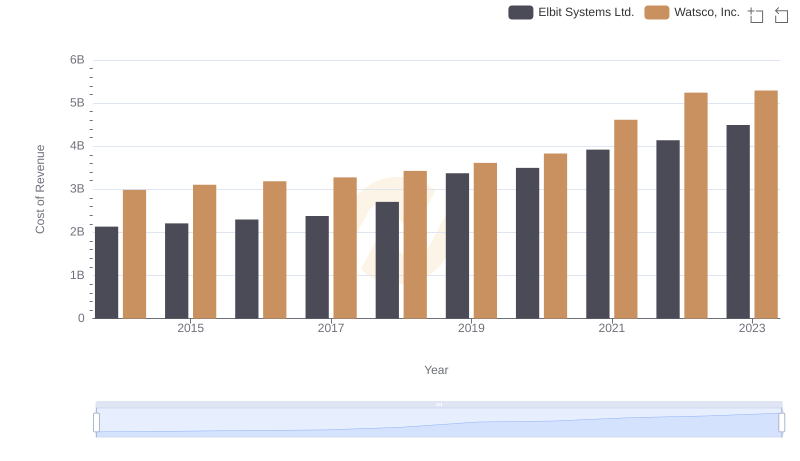
Comparing Cost of Revenue Efficiency: Watsco, Inc. vs Elbit Systems Ltd.
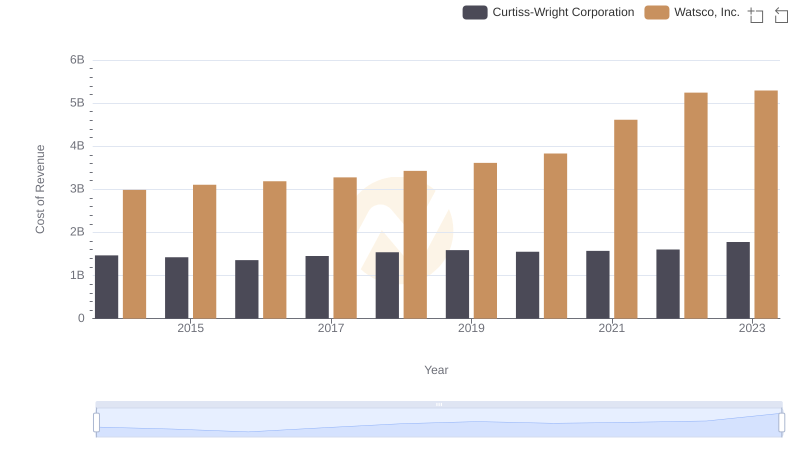
Cost of Revenue Comparison: Watsco, Inc. vs Curtiss-Wright Corporation
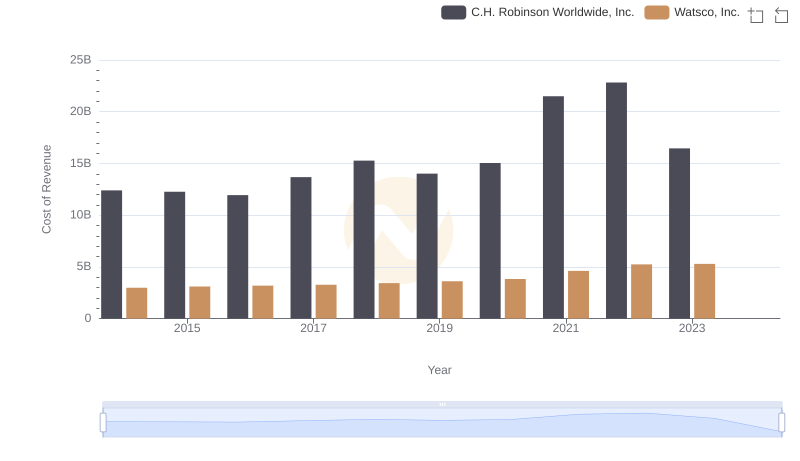
Cost of Revenue Comparison: Watsco, Inc. vs C.H. Robinson Worldwide, Inc.
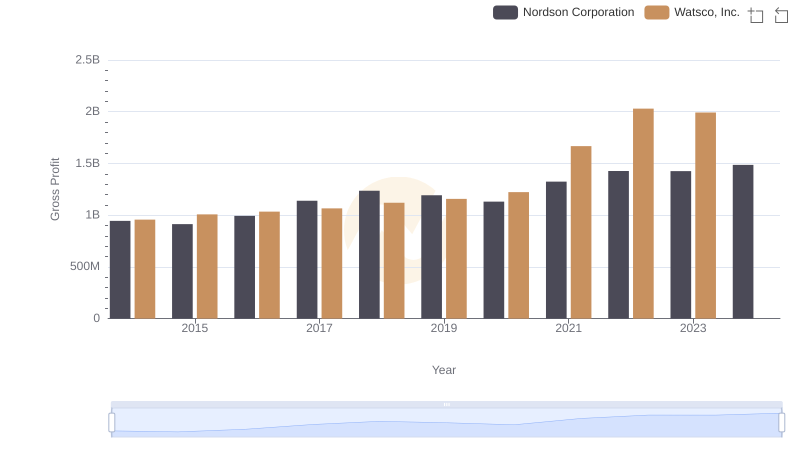
Watsco, Inc. and Nordson Corporation: A Detailed Gross Profit Analysis
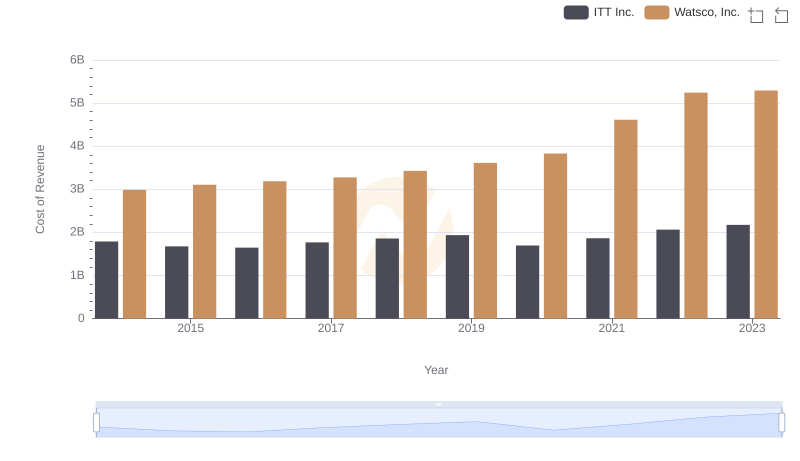
Cost of Revenue Comparison: Watsco, Inc. vs ITT Inc.
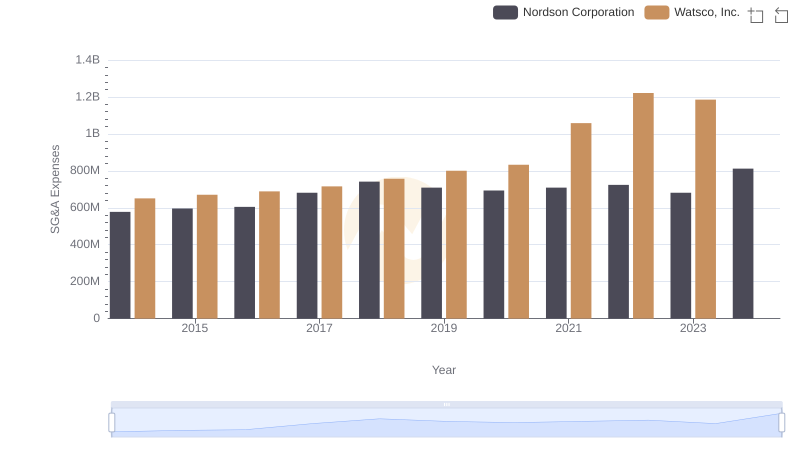
Who Optimizes SG&A Costs Better? Watsco, Inc. or Nordson Corporation
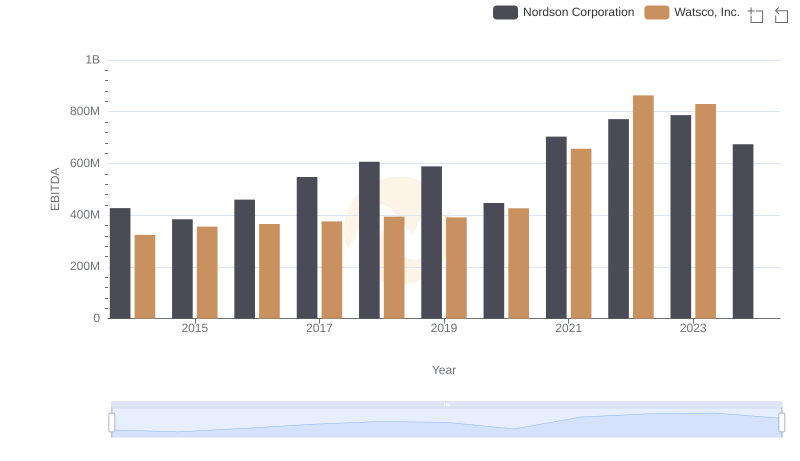
A Side-by-Side Analysis of EBITDA: Watsco, Inc. and Nordson Corporation