| __timestamp | TFI International Inc. | Watsco, Inc. |
|---|---|---|
| Wednesday, January 1, 2014 | 3199928501 | 3944540000 |
| Thursday, January 1, 2015 | 2904026835 | 4113239000 |
| Friday, January 1, 2016 | 2994723606 | 4220702000 |
| Sunday, January 1, 2017 | 3770194035 | 4341955000 |
| Monday, January 1, 2018 | 3761450188 | 4546653000 |
| Tuesday, January 1, 2019 | 3964619871 | 4770362000 |
| Wednesday, January 1, 2020 | 3781134000 | 5054928000 |
| Friday, January 1, 2021 | 7220429000 | 6280192000 |
| Saturday, January 1, 2022 | 8812491000 | 7274344000 |
| Sunday, January 1, 2023 | 7521167000 | 7283767000 |
| Monday, January 1, 2024 | 7618317000 |
Data in motion
In the ever-evolving landscape of industrial giants, Watsco, Inc. and TFI International Inc. have emerged as formidable players. Over the past decade, from 2014 to 2023, these companies have demonstrated remarkable revenue growth, reflecting their strategic prowess and market adaptability.
Watsco, Inc. has consistently outperformed, with a revenue increase of approximately 85% from 2014 to 2023. Notably, their revenue peaked in 2023, reaching nearly $7.3 billion. Meanwhile, TFI International Inc. experienced a staggering 135% growth, with revenues soaring to $8.8 billion in 2022, before slightly dipping in 2023.
The data reveals a significant revenue surge for both companies in 2021, with TFI International Inc. witnessing a 91% jump compared to the previous year. This period marked a pivotal moment, underscoring the resilience and strategic agility of these industry leaders.
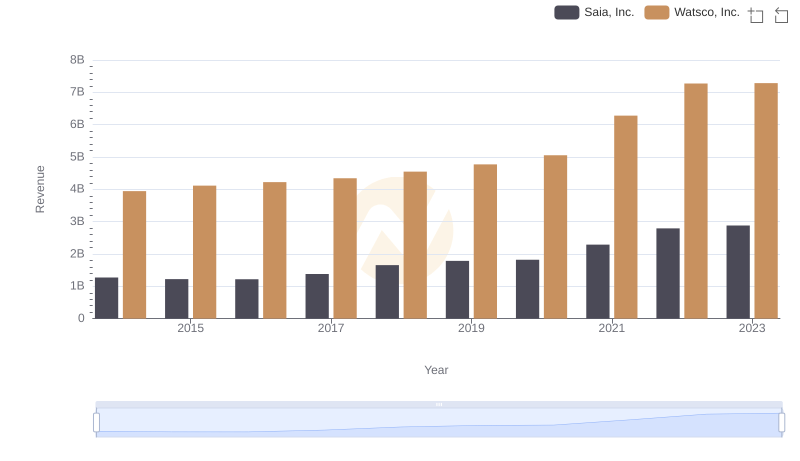
Annual Revenue Comparison: Watsco, Inc. vs Saia, Inc.
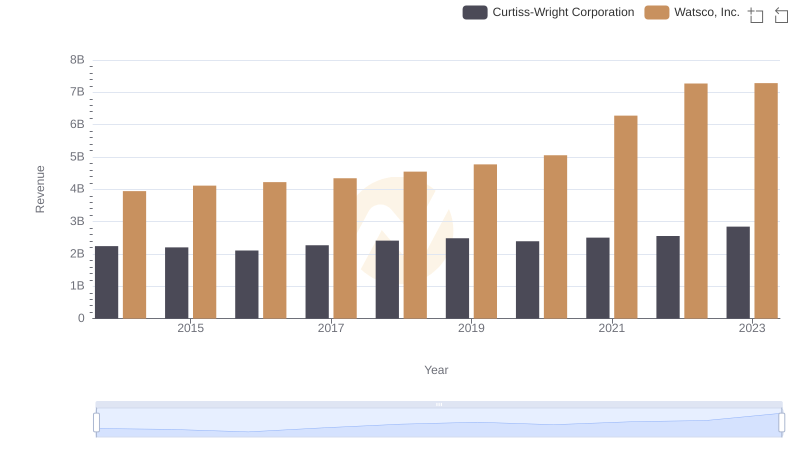
Breaking Down Revenue Trends: Watsco, Inc. vs Curtiss-Wright Corporation
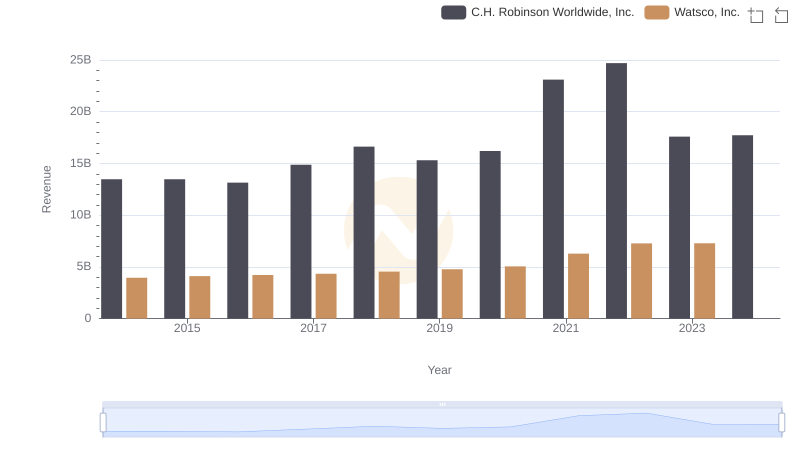
Annual Revenue Comparison: Watsco, Inc. vs C.H. Robinson Worldwide, Inc.
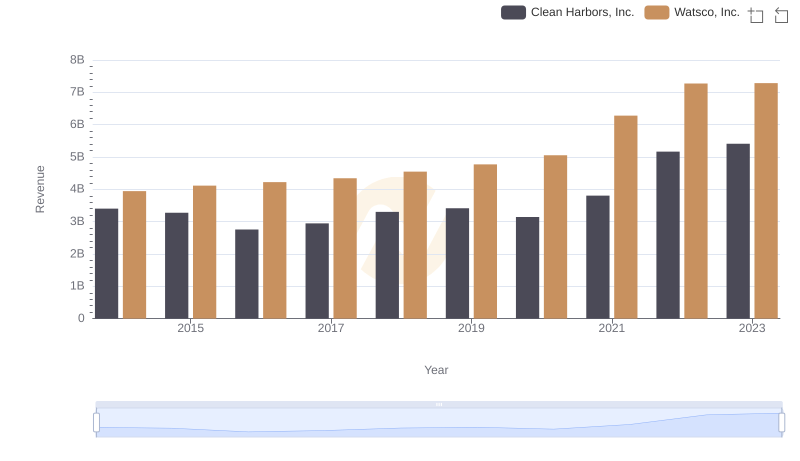
Watsco, Inc. vs Clean Harbors, Inc.: Annual Revenue Growth Compared
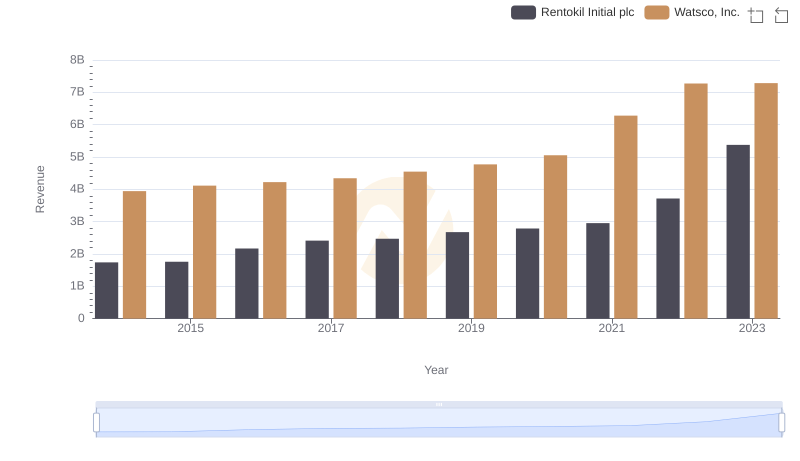
Watsco, Inc. and Rentokil Initial plc: A Comprehensive Revenue Analysis
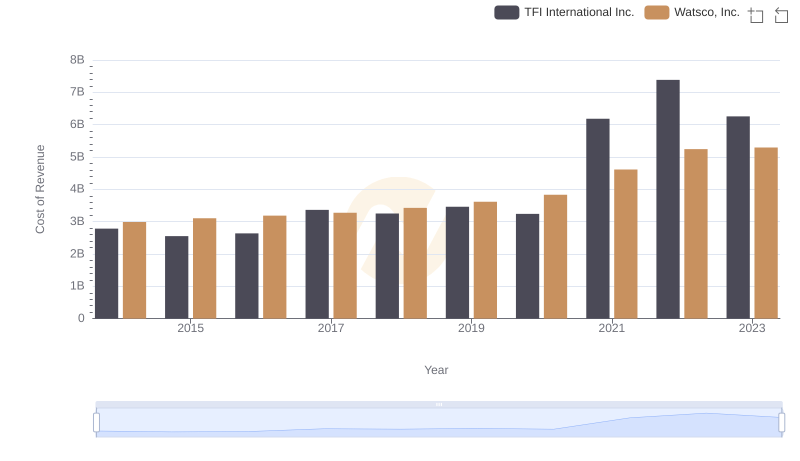
Watsco, Inc. vs TFI International Inc.: Efficiency in Cost of Revenue Explored
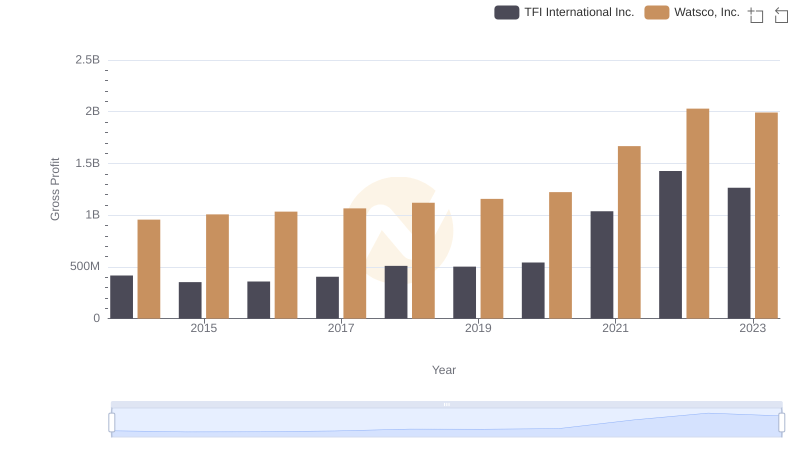
Key Insights on Gross Profit: Watsco, Inc. vs TFI International Inc.
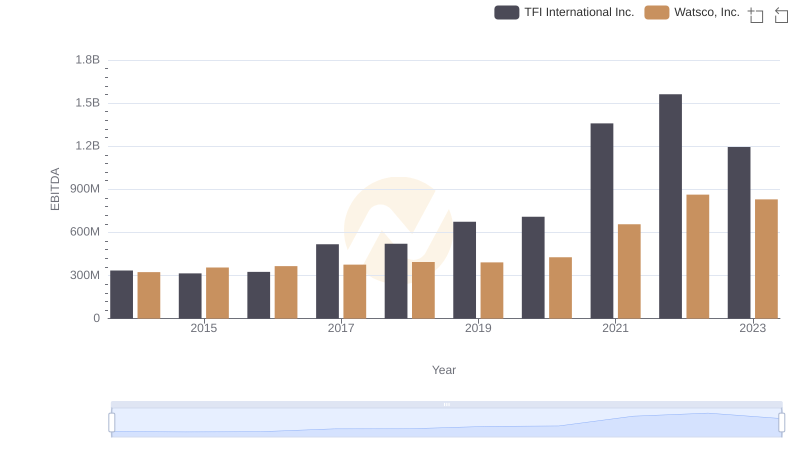
Watsco, Inc. vs TFI International Inc.: In-Depth EBITDA Performance Comparison