| __timestamp | American Airlines Group Inc. | Watsco, Inc. |
|---|---|---|
| Wednesday, January 1, 2014 | 31939000000 | 2988138000 |
| Thursday, January 1, 2015 | 27967000000 | 3105882000 |
| Friday, January 1, 2016 | 28339000000 | 3186118000 |
| Sunday, January 1, 2017 | 31154000000 | 3276296000 |
| Monday, January 1, 2018 | 34490000000 | 3426401000 |
| Tuesday, January 1, 2019 | 35379000000 | 3613406000 |
| Wednesday, January 1, 2020 | 24933000000 | 3832107000 |
| Friday, January 1, 2021 | 29855000000 | 4612647000 |
| Saturday, January 1, 2022 | 39934000000 | 5244055000 |
| Sunday, January 1, 2023 | 40978000000 | 5291627000 |
| Monday, January 1, 2024 | 5573604000 |
Infusing magic into the data realm
In the ever-evolving landscape of American business, the cost of revenue serves as a critical indicator of operational efficiency. This chart provides a decade-long comparison between Watsco, Inc., a leader in HVAC distribution, and American Airlines Group Inc., a titan in the aviation industry. From 2014 to 2023, American Airlines experienced a 28% increase in its cost of revenue, peaking in 2023. This reflects the airline's strategic expansions and the rising costs of fuel and labor. Meanwhile, Watsco, Inc. saw a 77% rise, highlighting its robust growth in the HVAC sector, driven by increased demand for energy-efficient solutions. The data underscores the contrasting dynamics of these industries, with Watsco's steady climb juxtaposed against American Airlines' more volatile trajectory. As we navigate the complexities of these sectors, understanding these trends is crucial for investors and industry analysts alike.
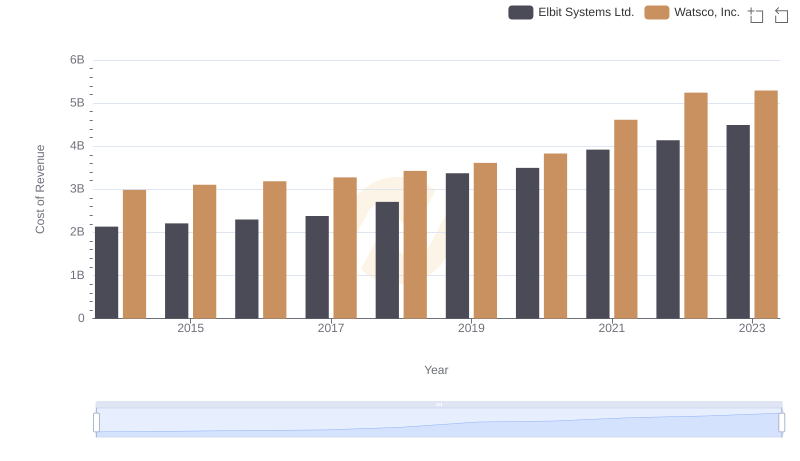
Comparing Cost of Revenue Efficiency: Watsco, Inc. vs Elbit Systems Ltd.
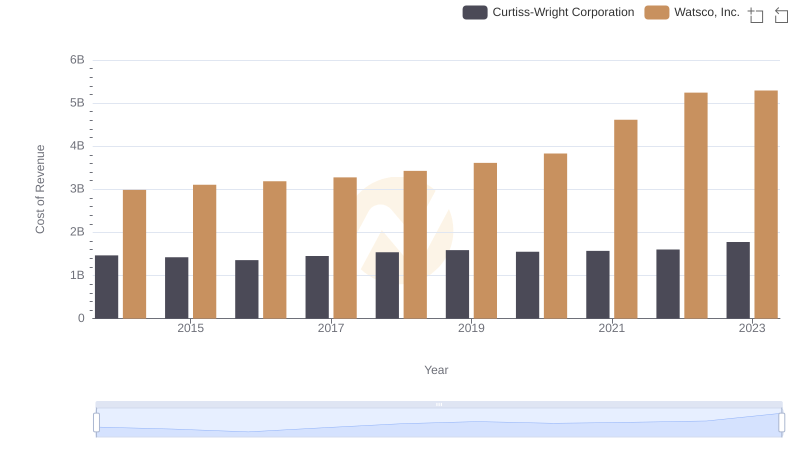
Cost of Revenue Comparison: Watsco, Inc. vs Curtiss-Wright Corporation
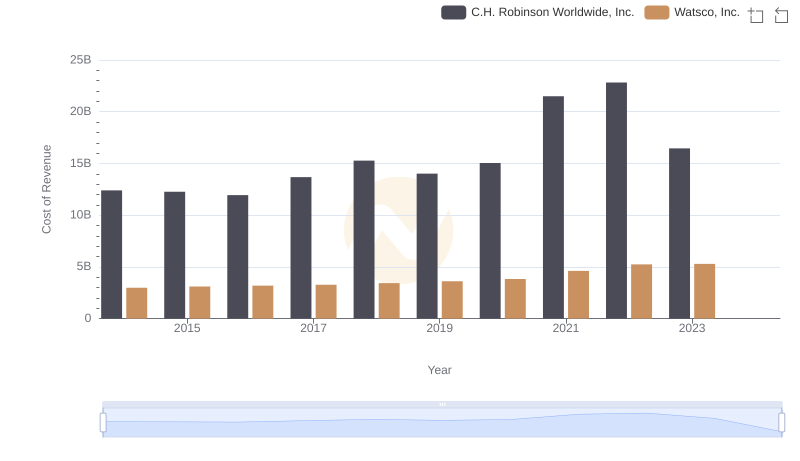
Cost of Revenue Comparison: Watsco, Inc. vs C.H. Robinson Worldwide, Inc.
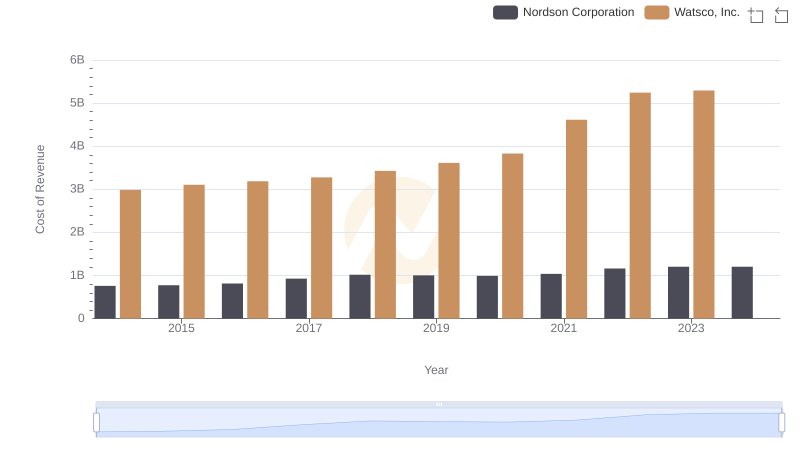
Analyzing Cost of Revenue: Watsco, Inc. and Nordson Corporation
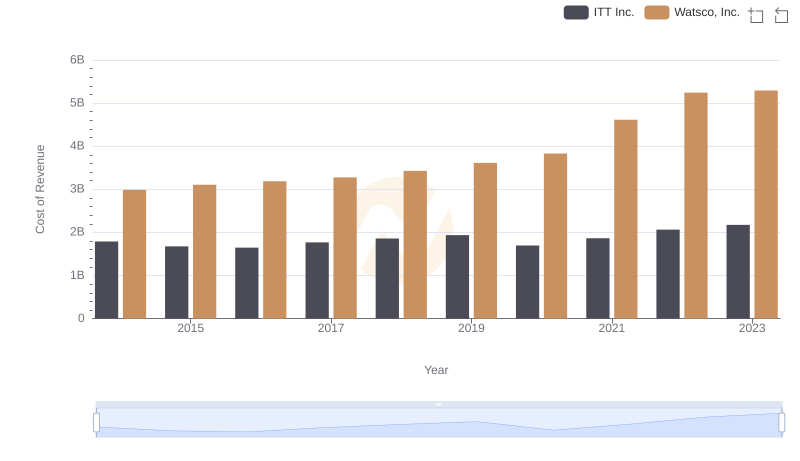
Cost of Revenue Comparison: Watsco, Inc. vs ITT Inc.
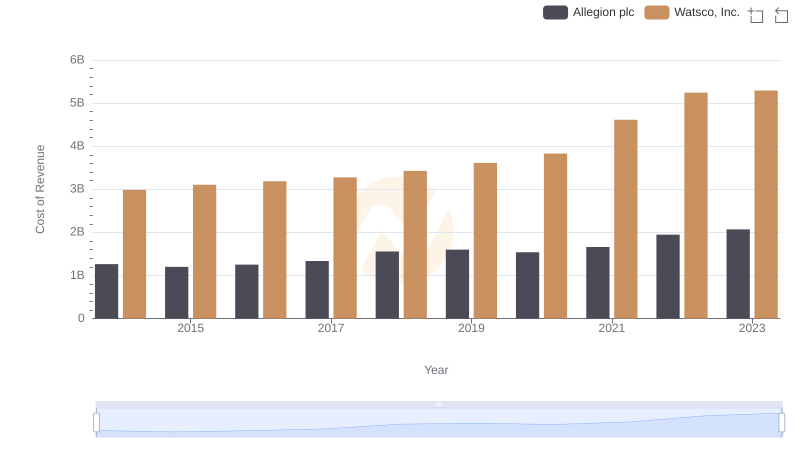
Comparing Cost of Revenue Efficiency: Watsco, Inc. vs Allegion plc
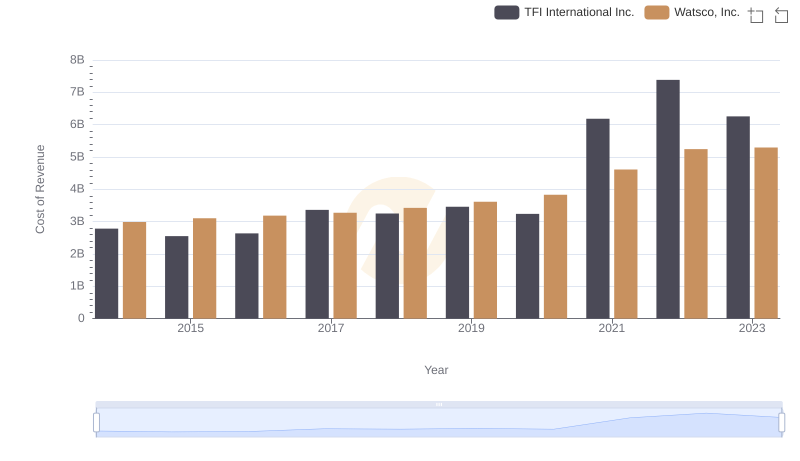
Watsco, Inc. vs TFI International Inc.: Efficiency in Cost of Revenue Explored