| __timestamp | TFI International Inc. | Watsco, Inc. |
|---|---|---|
| Wednesday, January 1, 2014 | 334908602 | 323674000 |
| Thursday, January 1, 2015 | 314924803 | 355865000 |
| Friday, January 1, 2016 | 325584405 | 365698000 |
| Sunday, January 1, 2017 | 517899005 | 375907000 |
| Monday, January 1, 2018 | 521265317 | 394177000 |
| Tuesday, January 1, 2019 | 674440000 | 391396000 |
| Wednesday, January 1, 2020 | 709296000 | 426942000 |
| Friday, January 1, 2021 | 1358717000 | 656655000 |
| Saturday, January 1, 2022 | 1561728000 | 863261000 |
| Sunday, January 1, 2023 | 1194213000 | 829900000 |
| Monday, January 1, 2024 | 781775000 |
Cracking the code
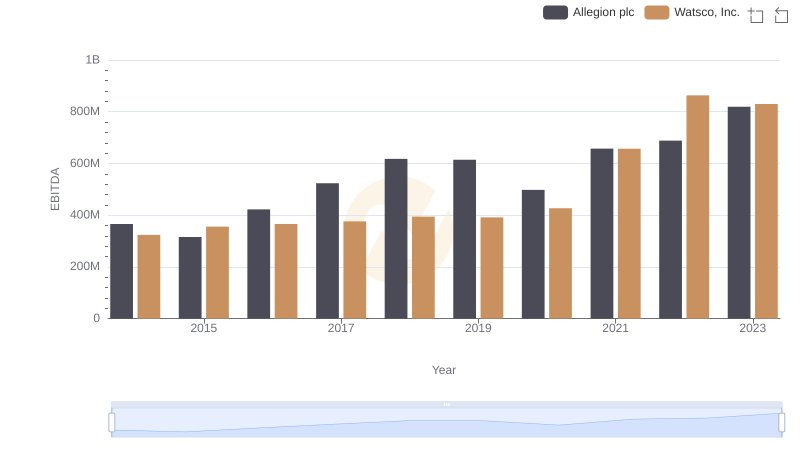
In the ever-evolving landscape of industrial giants, Watsco, Inc. and TFI International Inc. have demonstrated remarkable EBITDA growth over the past decade. From 2014 to 2023, TFI International Inc. has seen its EBITDA surge by an impressive 279%, peaking in 2022. Meanwhile, Watsco, Inc. has achieved a robust 157% increase, with its highest EBITDA recorded in 2022 as well.
TFI International Inc. consistently outperformed Watsco, Inc., with an average EBITDA that was approximately 50% higher. Notably, 2021 marked a significant leap for both companies, with TFI International Inc. experiencing a 91% increase from the previous year, while Watsco, Inc. saw a 54% rise.
This data underscores the resilience and strategic prowess of these companies in navigating economic challenges and capitalizing on growth opportunities, making them key players in their respective industries.
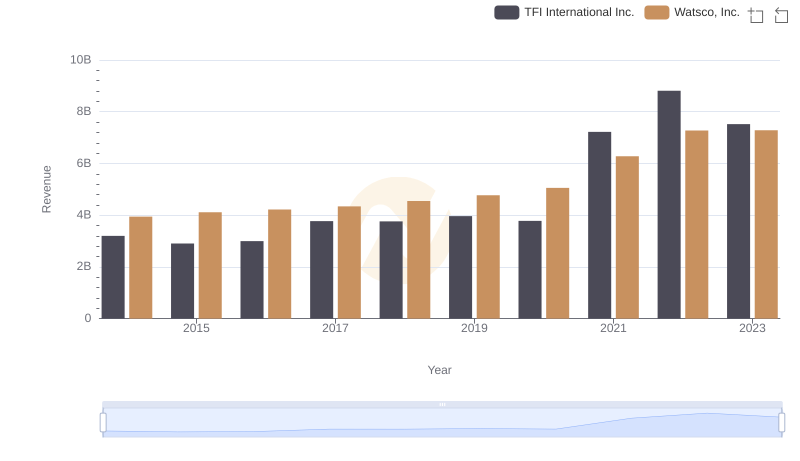
Watsco, Inc. vs TFI International Inc.: Examining Key Revenue Metrics
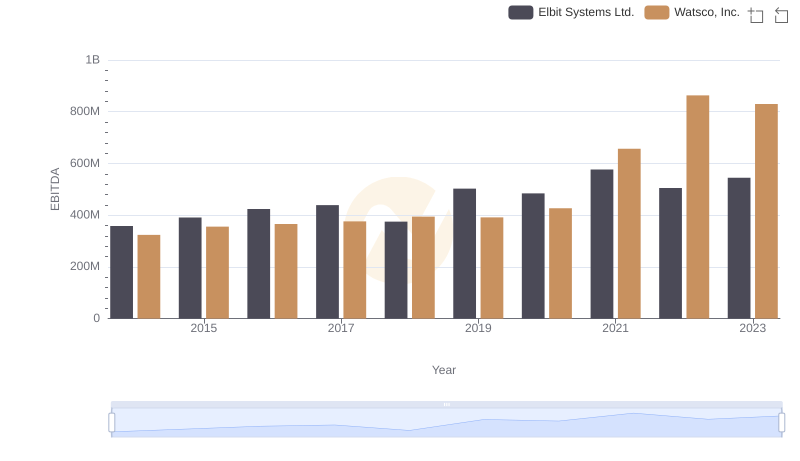
Watsco, Inc. vs Elbit Systems Ltd.: In-Depth EBITDA Performance Comparison
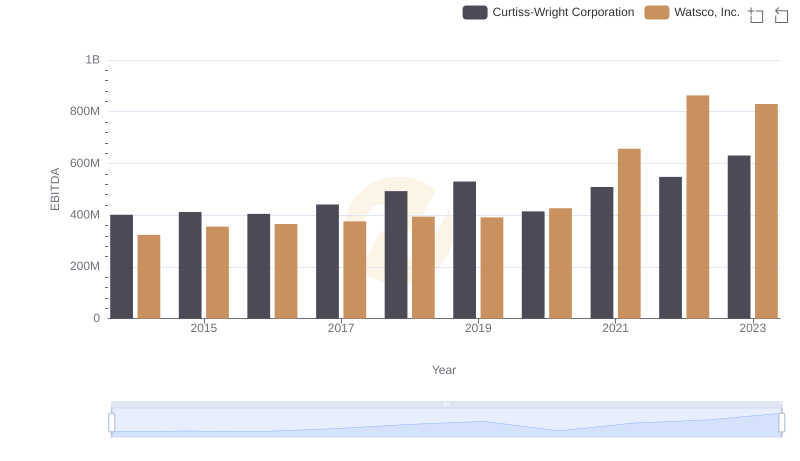
EBITDA Analysis: Evaluating Watsco, Inc. Against Curtiss-Wright Corporation
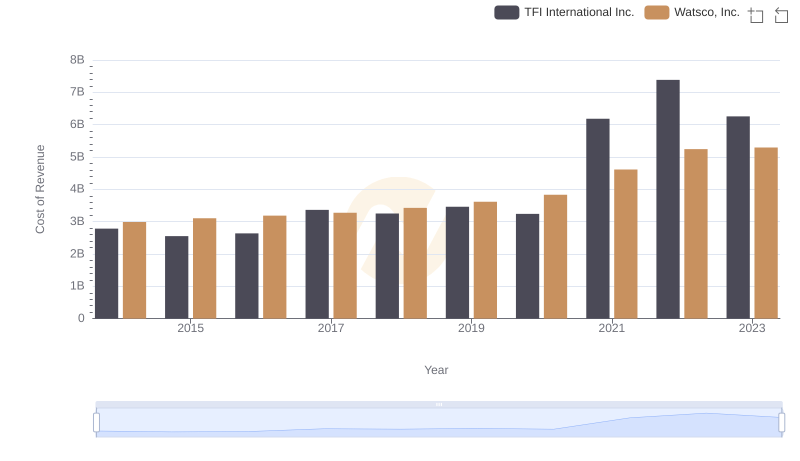
Watsco, Inc. vs TFI International Inc.: Efficiency in Cost of Revenue Explored
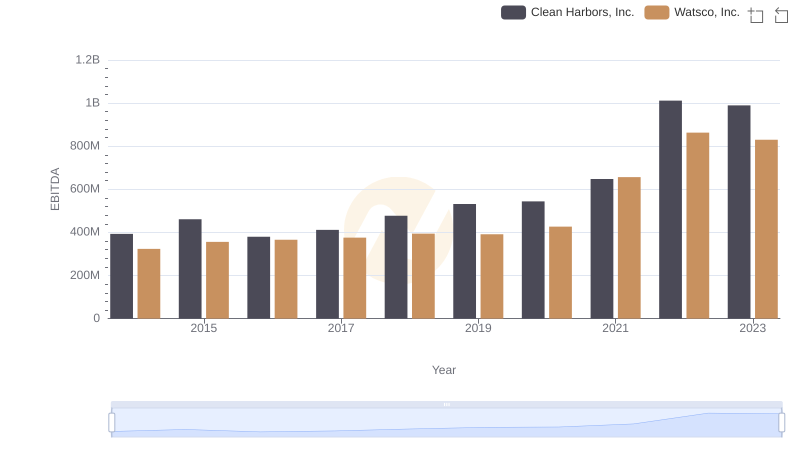
A Side-by-Side Analysis of EBITDA: Watsco, Inc. and Clean Harbors, Inc.
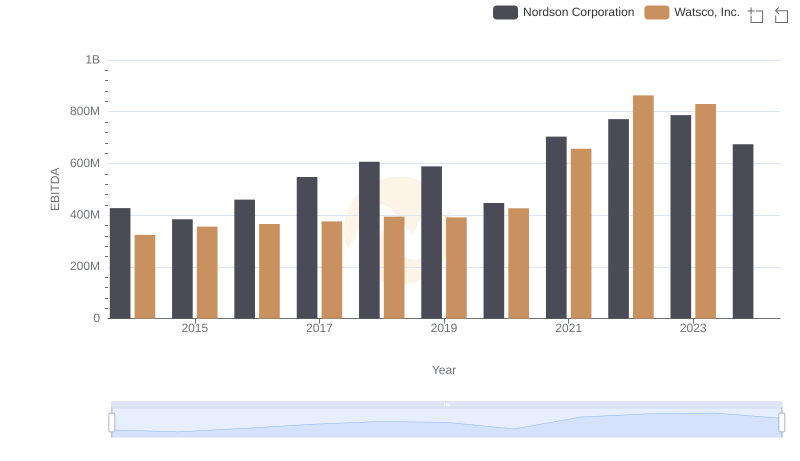
A Side-by-Side Analysis of EBITDA: Watsco, Inc. and Nordson Corporation
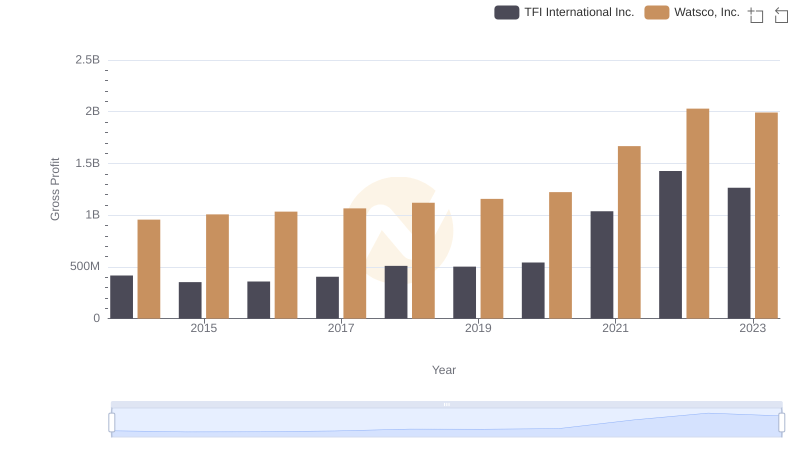
Key Insights on Gross Profit: Watsco, Inc. vs TFI International Inc.
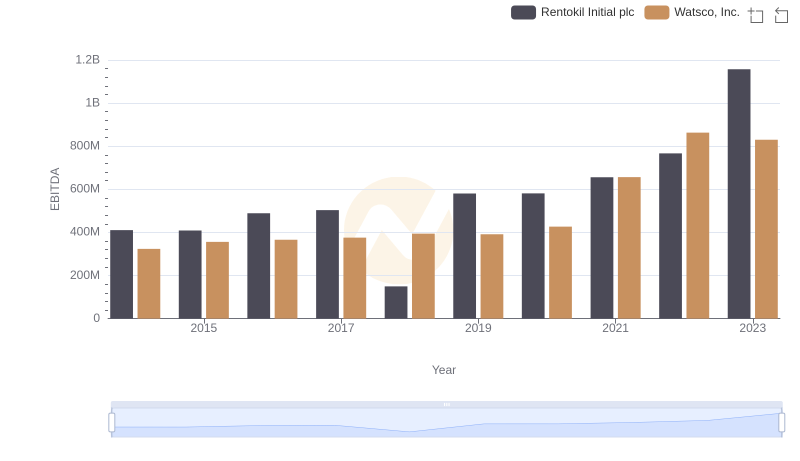
A Side-by-Side Analysis of EBITDA: Watsco, Inc. and Rentokil Initial plc
Watsco, Inc. vs Allegion plc: In-Depth EBITDA Performance Comparison