| __timestamp | ITT Inc. | Watsco, Inc. |
|---|---|---|
| Wednesday, January 1, 2014 | 1788200000 | 2988138000 |
| Thursday, January 1, 2015 | 1676500000 | 3105882000 |
| Friday, January 1, 2016 | 1647200000 | 3186118000 |
| Sunday, January 1, 2017 | 1768100000 | 3276296000 |
| Monday, January 1, 2018 | 1857900000 | 3426401000 |
| Tuesday, January 1, 2019 | 1936300000 | 3613406000 |
| Wednesday, January 1, 2020 | 1695600000 | 3832107000 |
| Friday, January 1, 2021 | 1865500000 | 4612647000 |
| Saturday, January 1, 2022 | 2065400000 | 5244055000 |
| Sunday, January 1, 2023 | 2175700000 | 5291627000 |
| Monday, January 1, 2024 | 2383400000 | 5573604000 |
Unleashing insights
In the competitive landscape of industrial and HVAC sectors, Watsco, Inc. and ITT Inc. have shown distinct trajectories in their cost of revenue from 2014 to 2023. Watsco, Inc., a leader in HVAC distribution, has seen its cost of revenue soar by approximately 77%, reaching over $5.29 billion in 2023. This growth reflects its expanding market presence and operational scale. In contrast, ITT Inc., a diversified manufacturer, experienced a more modest increase of around 22%, with its cost of revenue peaking at $2.18 billion in the same year. This divergence highlights the differing business models and market strategies of these two giants. As Watsco continues to capitalize on the growing demand for HVAC solutions, ITT's steady growth underscores its resilience in a fluctuating industrial landscape. This comparison offers a fascinating glimpse into how industry dynamics shape financial outcomes over time.
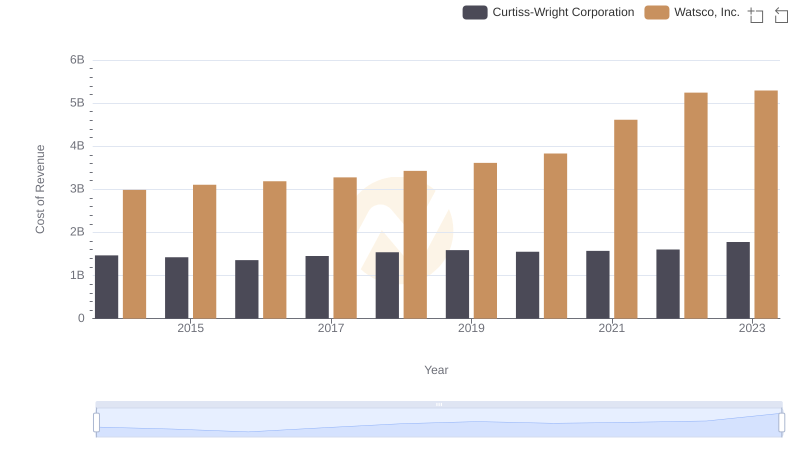
Cost of Revenue Comparison: Watsco, Inc. vs Curtiss-Wright Corporation
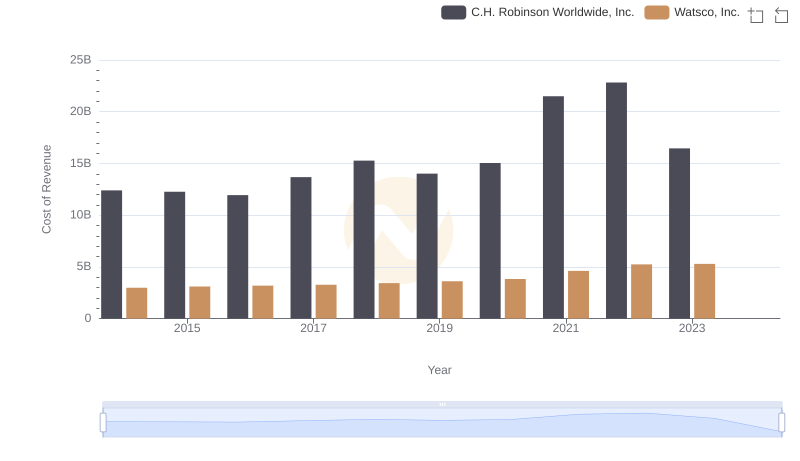
Cost of Revenue Comparison: Watsco, Inc. vs C.H. Robinson Worldwide, Inc.
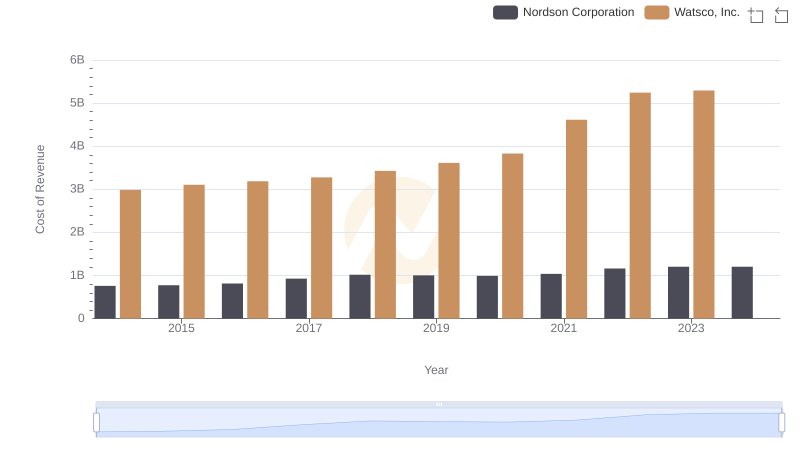
Analyzing Cost of Revenue: Watsco, Inc. and Nordson Corporation
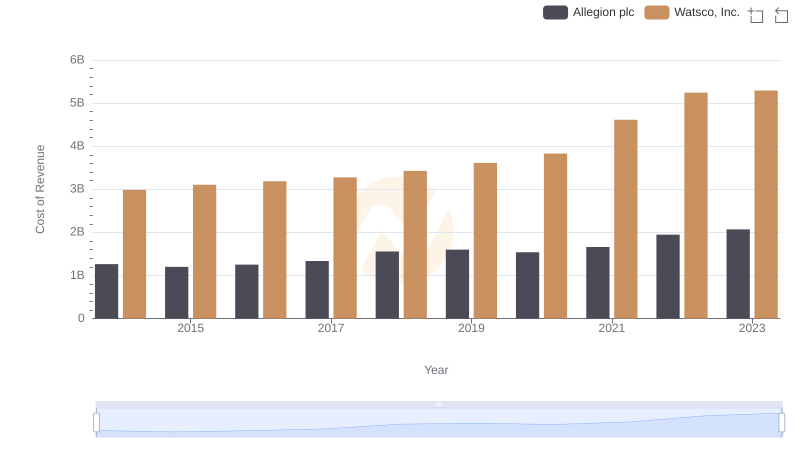
Comparing Cost of Revenue Efficiency: Watsco, Inc. vs Allegion plc
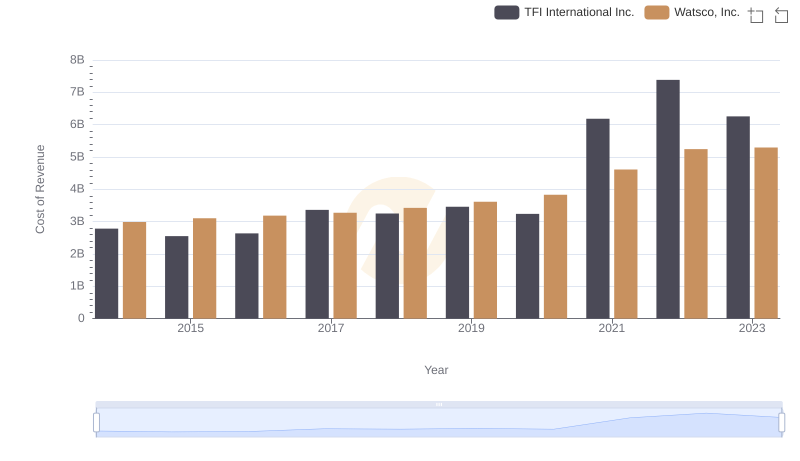
Watsco, Inc. vs TFI International Inc.: Efficiency in Cost of Revenue Explored
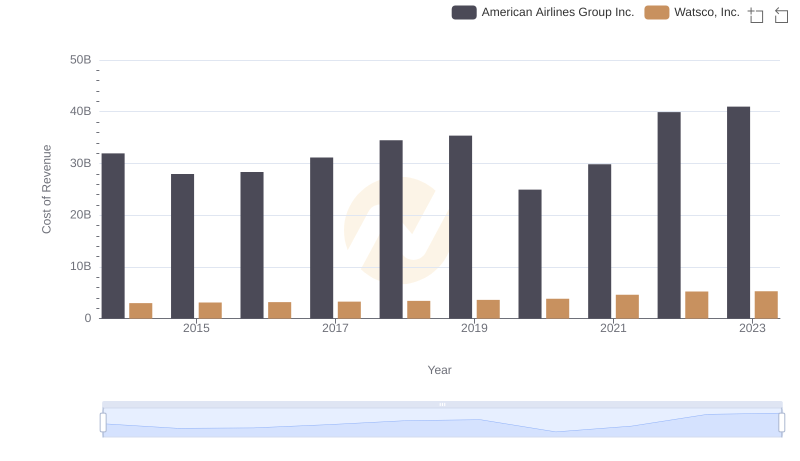
Cost of Revenue: Key Insights for Watsco, Inc. and American Airlines Group Inc.
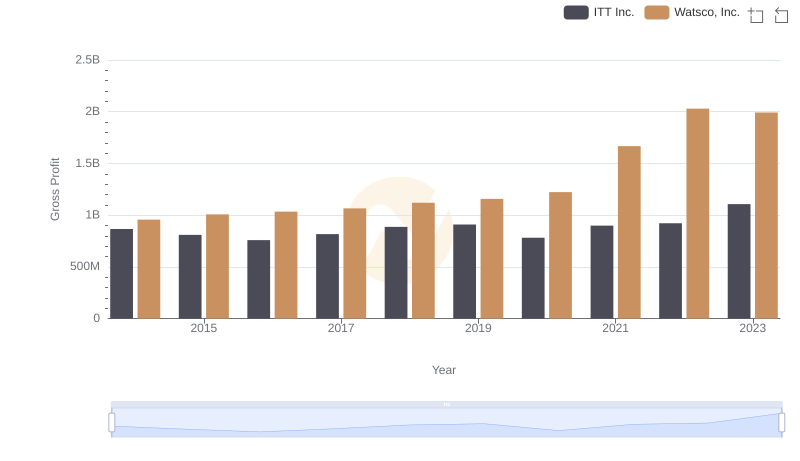
Key Insights on Gross Profit: Watsco, Inc. vs ITT Inc.
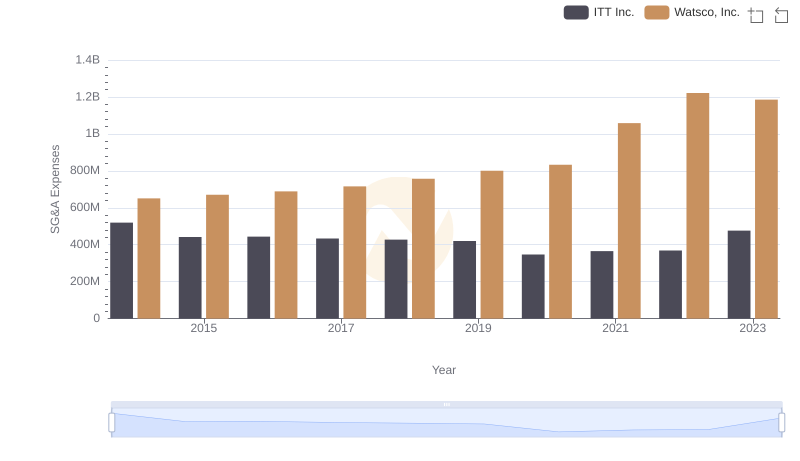
Watsco, Inc. or ITT Inc.: Who Manages SG&A Costs Better?